


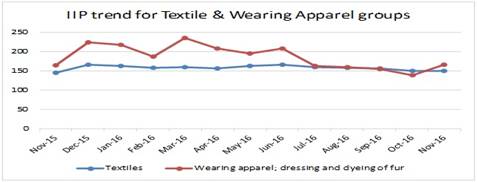
The Index of Industrial Production (IIP) showed a positive growth of 3.88 per cent in November 2016, with the cumulative growth for April-November 2016 being 2.36 per cent as compared to corresponding period of last year. The IIP trend for the textiles industry was almost flat from November 2015 to November 2016, with very less fluctuation seen during the period, writes Market Intelligence, Fibre2Fashion.
Short-term indicators play an important role in economic analysis by providing a comparison of economic performance over time, which is a fundamental requirement for policymaking. The Index of Industrial Production (IIP) is one of the most important short-term indicators; it measures volume changes in the production of an economy, and subsequently gives an estimation that is free from influences of price changes. This indicator is of foremost significance to the government for policy-planning purposes and is also being extensively utilised by different organisations including, research institutes, academicians, and industrial associations.
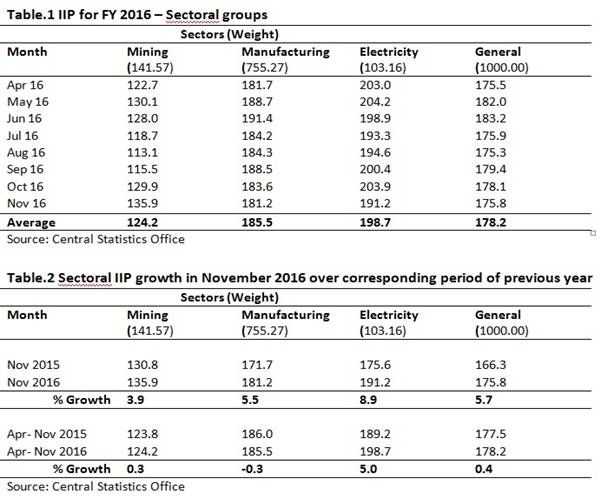
The IIP details the development of different sectors in an economy. The general scope of the IIP, as suggested by the United Nations Statistics Division (UNSD), incorporates mining and quarrying, manufacturing, electricity, gas steam and air-conditioning supply, as well as water supply, sewerage, waste management and remediation activities. But due to constraints like data availability and other resources, the present general IIP compiled in India has in its scope the mining, manufacturing, and electricity sectors only. The bifurcation of mining, manufacturing, and electricity production in overall IIP are 14.16 per cent, 75.52 per cent and 10.32 per cent, respectively.
The all-India IIP is a composite indicator measuring short-term changes witnessed in the volume of production of a set of industrial products in a given period with respect to a pre-defined base period. The Central Statistics Office (CSO) (under the ministry of statistics and programme implementation) compiles and publishes it with a month-and-a-half time lag from the reference month. The level of IIP is an abstract number and its magnitude represents the production status for a given period, compared to a reference period. The base year was fixed so that the year was assigned an index level of 100.
The recent IIP report for November 2016 by the CSO with 2004-05 as the base year has been compiled using data that was received from the following 15 source agencies:
i. Department of Industrial Policy & Promotion (DIPP)
ii. Central Electricity Authority
iii. Indian Bureau of Mines
iv. Joint Plant Committee, Ministry of Steel
v. Office of Textile Commissioner
vi. Ministry of Petroleum & Natural Gas
vii. Department of Chemicals & Petrochemicals
viii. Directorate of Sugar & Vegetable Oils
ix. Office of Coal Controller
x. Office of Jute Commissioner
xi. Department of Fertilizers
xii. Railway Board
xiii. Office of Salt Commissioner
Find comprehensive analysis & detailed reporting on related subjects here.
xiv. Tea Board
xv. Coffee Board
IIP for sectoral industry groups
According to the CSO report, the IIP for sectoral industry groups registered an overall growth of 5.7 per cent in November 2016 over the month of November 2015, and the general Index was recorded as 175.8 for November 2016, which was 166.3 last year. The cumulative growth for the period from April to November in 2016 over the same period of the previous year was recorded as 0.4 per cent (Table 2).
In the month of November 2016, the IIP for the mining, manufacturing, and electricity sectors were recorded as 135.9, 181.2 and 191.2, respectively, and the corresponding growth rates for the same over the index of November 2015 were 3.9 per cent, 5.5 per cent and 8.9 per cent, respectively. The cumulative IIP for these three sectors during April-November 2016 were 124.2, 185.5 and 198.7. The cumulative growth rate in these three sectors has been recorded as 0.3 per cent, (-) 0.3 per cent and 5.0 per cent respectively over the corresponding period of 2015 (Table 2).
Find comprehensive analysis & detailed reporting on related subjects here.
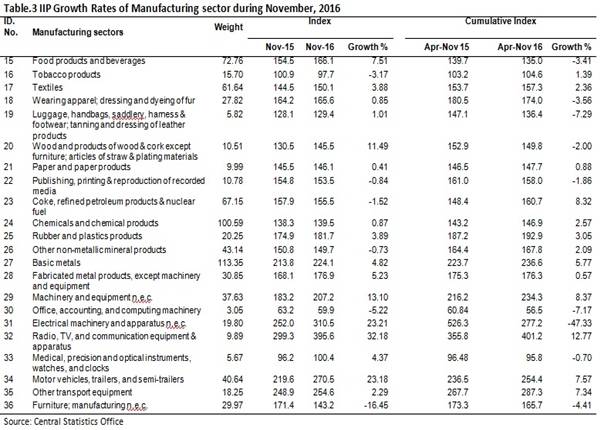
In the manufacturing sector, 15 out of 22 industry groups demonstrated positive growth during November 2016, as compared to November 2015. The 'radio, TV and communication equipment and apparatus' industry group recorded the highest growth of 32.18 per cent followed by 23.21 per cent in 'electrical machinery and apparatus n.e.c.' group and 23.18 per cent in 'motor vehicles, trailers and semi-trailers' group. On the other hand, 'furniture; manufacturing n.e.c.' recorded the highest negative growth of 16.45 per cent followed by 5.22 per cent in 'office, accounting and computing machinery' and 3.17 per cent in 'tobacco products' (Table 3).
IIP for use-based industry groups
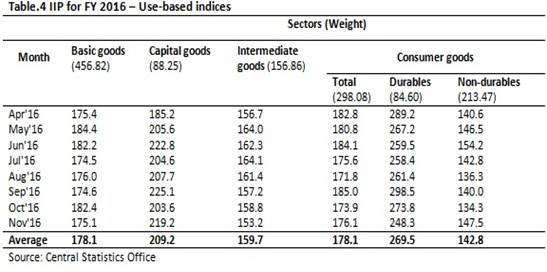
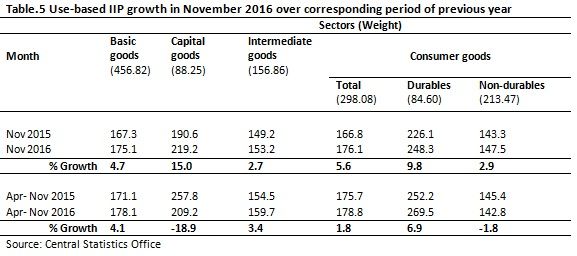
After use-based classification, the growth rates for basic goods, capital goods and intermediate goods were 4.7 per cent, 15 per cent and 2.7 per cent during November 2016 over November 2015. The growth rate for consumer durables and consumer non-durables were 9.8 per cent and 2.9 per cent, respectively, and the total growth for consumer goods was 5.6 per cent. Cumulatively, the index of basic goods, and intermediate goods registered positive growth of 4.1 per cent and 3.4 per cent, respectively, whereas capital goods showed negative growth of 18.9 per cent during April-November 2016 over the corresponding period of 2015. Overall, the cumulative growth for consumer goods was 1.8 per cent, while the cumulative growth of consumer durables demonstrated 6.9 per cent positive growth and non-durables demonstrated 1.8 per cent of negative growth during the same period.
Find comprehensive analysis & detailed reporting on related subjects here.
IIP for textile industries groups
The weightage of the textile industry group in general IIP is 6.16 per cent and it showed a positive growth of 3.88 per cent in November 2016 and the cumulative growth in April-November 2016 was observed as 2.36 per cent as compared to corresponding period of last year. Apparel, dressing and dyeing of fur group indicated a positive growth of 0.85 per cent in November 2016 whereas for April-November 2016 those registered a negative cumulative growth of 3.56 per cent as over the corresponding period of last year and its weightage in general IIP is 2.78 per cent (Table 3).
Find comprehensive analysis & detailed reporting on related subjects here.
The IIP trend for the textiles industry group was almost flat during November 2015 to November 2016, and very less fluctuation was observed during the period. The minimum IIP (144.5) was seen in November 2015 and maximum IIP (166.2) was observed in December 2016 for the textiles group.
Changes in trend was high for IIP of apparel, dressing and dyeing of fur group with the maximum IIP (235.9) being seen in March 2016 and minimum IIP (139.4) being observed during October 2016.
Find comprehensive analysis & detailed reporting on related subjects here.


Comments