


Wazir Advisors had recently introduced its Wazir Textile Index (WTI) as a barometer to periodically assess the financial performance of the Indian textiles industry. It has now released its latest WTI which looks at the cumulative financial performance of the top Indian textile companies along with an update on the market performance of the sector for the first half year of FY18 (H1 FY18).
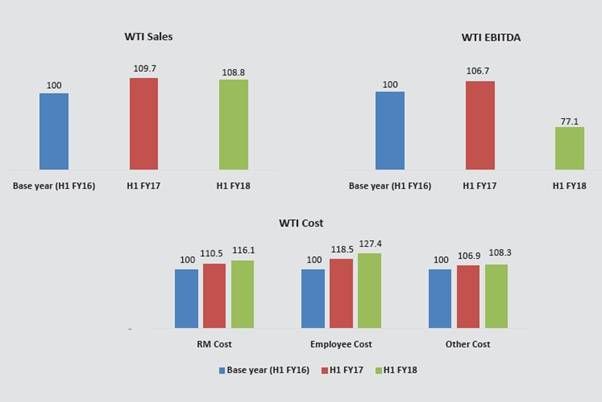
The Wazir Textile Index (WTI) Sales, based on detailed financial analysis of the top ten textile companies, has been calculated to be 108.8 in H1 FY18 as compared to 109.7 in H1 FY17. This indicates that the overall consolidated sales declined by 1 per cent this half financial year.
The earnings before interest, taxes, depreciation and amortization (EBITDA) has also declined significantly in H1FY18. The consolidated WTI EBIDTA stood at 77.1 in H1 FY18 as compared to 106.7 in H1 FY17, falling drastically by 28 per cent. Due to the introduction of the goods and services tax (GST), there was an impact on demand in Q2, which impacted overall sales and profitability in H1 FY18. Moreover, there has been an increase in employee and RM cost which has dented the EBITDA margins.
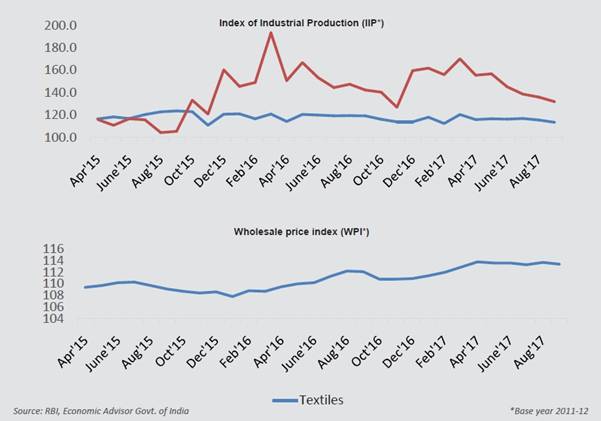
Economy growing but industrial production declines
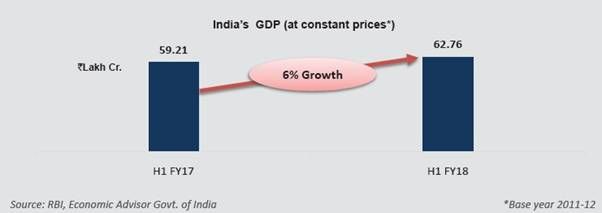
The key economic indicators analysed in the index were gross domestic product (GDP), index of industrial production (IIP) and wholesale price index (WPI) for the textiles and apparel sector. According to the index, India's real GDP has grown by 6 per cent in H1 FY18 compared to H1 FY17.
The average IIP for textiles has declined by 2 per cent, while IIP for apparel has declined by 5 per cent in H1 FY18 compared to H1 FY17. The decreased IIP may be attributed to lower demands from the market side as a result of the GST. In line with the increase in raw material prices, the average WPI for textiles has shown an increase of 2.4 per cent in H1 FY18 compared to H1 FY17.
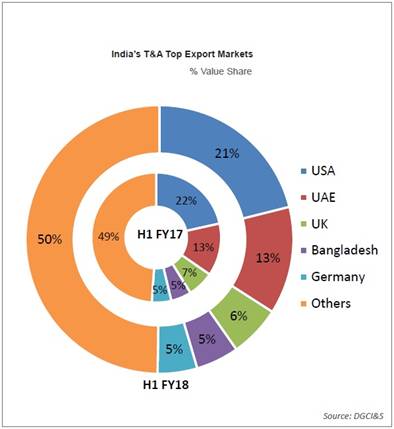 Indian exports have shown healthy growth
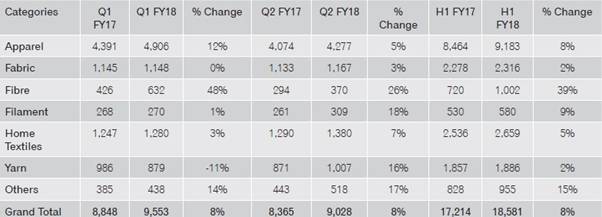
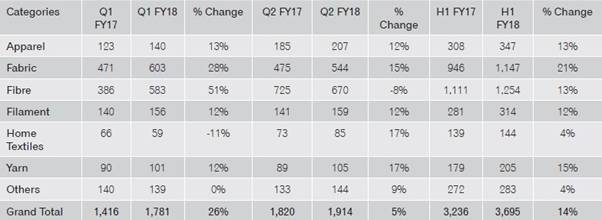
Indian exports of textiles and apparel products stood at $18.5 billion in first half of FY18, increasing by 8 per cent as compared to previous half year. Exports of all the categories have grown in H1 FY18 as compared to H1 FY17. Fibre exports have grown significantly at a rate of 39 per cent driven by cotton fibre exports growth of around 70 per cent. Fibre exports to Bangladesh and China increased by 43 per cent and 33 per cent respectively in H1 FY18 as compared to H1 FY17. Exports of yarn revived significantly in Q2 FY18 against a decline of 11 per cent in Q1 FY18 vis-a-vis FY17. The US and UAE continue to be the two largest export markets with a cumulative share of roughly 35 per cent.
India's Textiles and Apparel Exports (in US$ million)
India's imports are on the rise
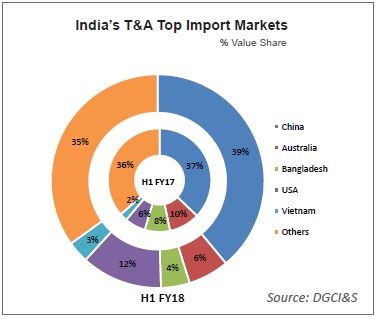 India imported textiles and apparel products worth $3.7 billion in H1 FY18, registering a growth of 14 per cent as compared to H1 FY17. The import of all categories has increased during H1 FY18. Fabric imports have increased the most in H1 compared to other categories. Imports of fibres reduced in Q2 after a significant increase in Q1; hence, the overall import growth in Q2 was lower than Q1. China continues to be the largest import partner for India. The import share of the US has increased significantly from 6 per cent to 12 per cent, primarily due to increase in cotton imports.
India's Textiles and Apparel Imports (in US$ million)
Imports of US and EU has increased slightly
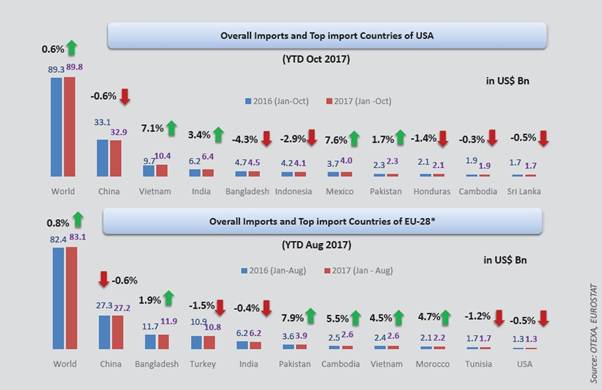
The overall imports of the US stood at $89.8 billion in 2017 (January-October), registering a growth of 0.6 per cent over the same duration last year. Similarly, EU's imports of textiles and apparel products increased slightly by 0.8 per cent in 2017 (January-August). The European Union's imports increased by around $1 billion in 2016 (January-August) to reach $83 billion in 2017 (January-August). India's exports of textiles and apparel products to the US increased significantly by 3.4 per cent in 2017 (January-October) as compared to 2016 (January-October), while the same to the EU declined slightly by 0.4 per cent (January-August). China is the largest supplier to the US and EU, contributing about 35 per cent share in total textiles and apparel imports of these nations. However, its exports to these markets declined slightly this year as compared to last year. Other major suppliers of textiles and apparel to the US and EU are Bangladesh, Vietnam, India, Indonesia, Turkey and Cambodia.
Despite fluctuations, raw material prices increased
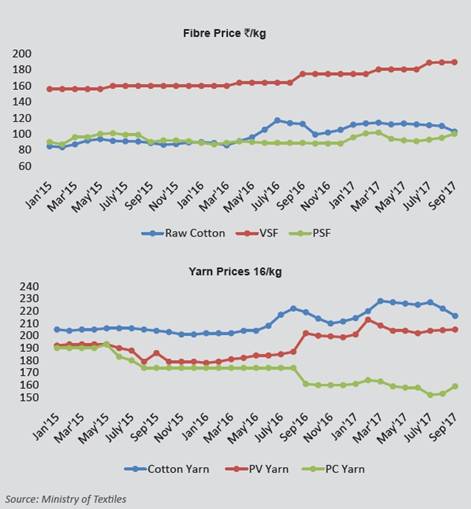 Overall, there was an increase in raw material prices in H1 FY18 compared to H1 FY17. On an average basis, raw cotton, viscose staple fibre and polyester staple fibre prices increased by 4 per cent, 12 per cent and 5 per cent respectively in H1 FY18. Similarly, there was an increase in cotton yarn and polyester viscose blended yarn average prices growing at a rate of 5 per cent and 9 per cent respectively in H1 FY18. However, polyester cotton blended yarn registered a decline of 9 per cent in H1 FY18 compared to H1 FY17 on an average.
Overall, the Indian textiles and apparel industry has been impacted negatively during first half of year 2017 in terms of sales and profitability (especially post- GST). Although overall exports have shown healthy growth, textiles and apparel imports are on a rising trend indicating growing threat for the domestic manufacturers and needs to be observed closely as well.


Comments