


The Indian textiles & apparel industry showed a marginal growth in terms of overall sales and EBIDTA levels during first nine months of 2019–20. The sector is struggling in terms of exports with a decline of 7 per cent in 9M FY20 as compared to that in 9M FY19.
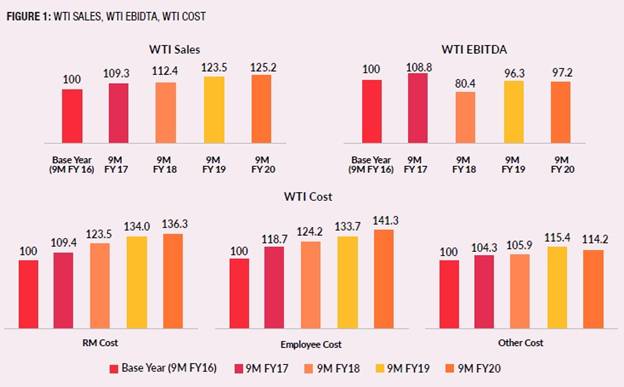
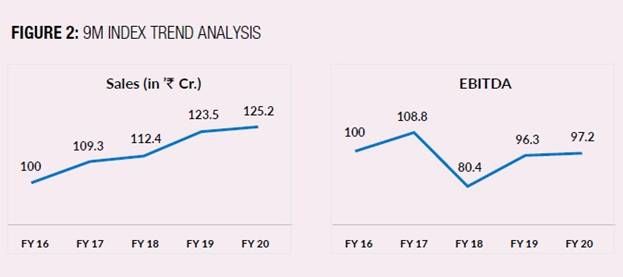
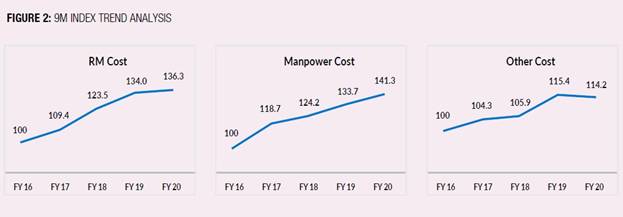
The Wazir Textiles Index (WTI), which assesses the cumulative financial performance of the top Indian textiles companies, has released its findings on the market performance of the sector for 9M FY20. The WTI Sales was calculated to be 125.2 during 9M FY20 (base year FY16=100), which increased by 1 per cent as compared to 9M FY19. The WTI EBITDA was calculated to be 97.2 in 9M FY 20, showing a growth of 1 per cent from the value of 96.3 in 9M FY19. The WTI Cost for raw material (RM), employee and other expenses were 136.3, 141.3 and 114.2, respectively, in 9M FY20.
The consolidated sales of the selected top 10 companies was ₹30,404 crore in 9M FY20 as compared to ₹29,974 crore in 9M FY19, growing by 1 per cent Y-O-Y. As compared to 9M FY19, the average EBITDA margin declined by 0.1 percentage points in 9M FY20 for the selected top companies. The average RM cost increased slightly by 0.2 percentage points, while the average employee cost increased by 0.4 percentage points in 9M FY20 as compared to the same period during the previous financial year.
Overall Financial Performance of Textiles Sector
The 9M sales index has grown from the base value 100 in 9M FY16 to the value of 125.2 in 9M FY20. This depicts that the sales index has shown a significant growth of CAGR 5 per cent over the last five years. The 9M EBITDA index showed a significant dip reaching at an index of 80.4 in 9M FY18, but has shown some improvement over the last two years with a CAGR of 10 per cent from the value of 80.4 in 9M FY18 to a value of 97.2 in 9M FY20. The 9M RM Cost Index has also shown a significant increase in last five years with a CAGR of 6 per cent from the base value of 100 in 9M FY16 to a value of 136.3 in 9M FY20. So far, the 9M Manpower Cost Index has also increased over the last five years with a CAGR of 7 per cent from the base value of 100 in 9M FY16 to a value of 141.3 in 9M FY20. Other Costs Index has also shown a steady increment in the last five years with a CAGR of 3 per cent from the base value of 100 in 9M FY16 to a value of 114.2 in 9M FY20. However, it has shown a decline of 1 per cent from 9M FY19, dropping from a value of 115.4 in 9M FY19 to a value of 114.2 in 9M FY20.
GDP Growth Shows Marginal Improvement
India’s gross domestic product (GDP) stood at ₹108.49 lakh crore in 9M FY20, as against ₹103.57 lakh crore in 9M FY19, witnessing a growth of only 4.8 per cent.
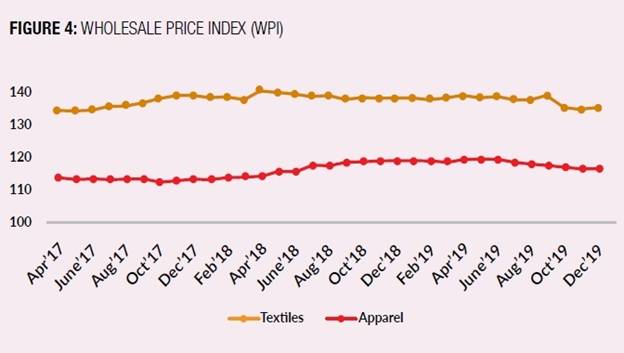
The average Index of Industrial Production (IIP) for apparel increased significantly by 6 per cent in 9M FY20 as compared to 9M FY19, while that of textiles showed a marginal decrease of 2 per cent. In 9M FY20, the Wholesale Price Index (WPI) for textiles and apparel registered a decrease of 0.6 per cent and 1.2 per cent, respectively.
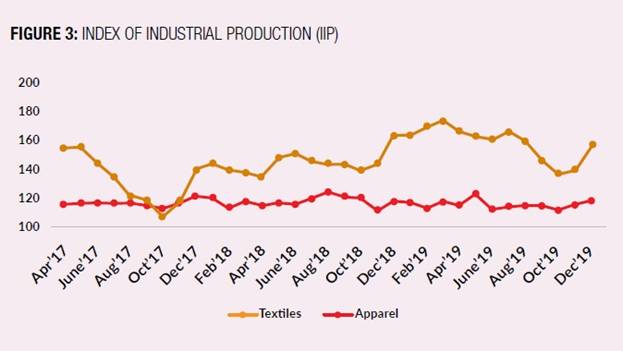
Data Source: Ministry of Statistics and Program Implementation (Base Year 2011-12)
Data Source: Ministry of Statistics and Program Implementation (Base Year 2011-12)

Overall Textiles & Apparel Exports Declining
The textiles & apparel exports in 9M FY20 stood at $25 billion, showing a dip of 7 per cent from 9M FY19. The exports of fibres and yarn have shown a significant decline of 47 per cent and 30 per cent, respectively. This is due to the decline in exports to China (exports of fibres and yarn reduced by $245 million and $507 million, respectively). On the contrary, exports of fabrics showed a growth of 8 per cent and that of apparel a growth of 1 per cent. The share of the US increased by 2 per cent in 9M FY20 as compared to that of 9M FY19, while that of China declined by 3 per cent.
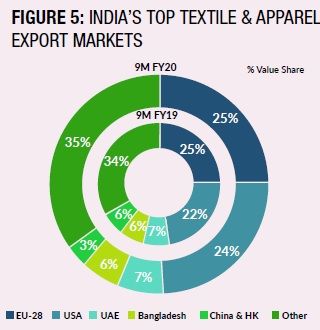
Table 1: India’s Textile & Apparel Exports (Values In Us$ Million)
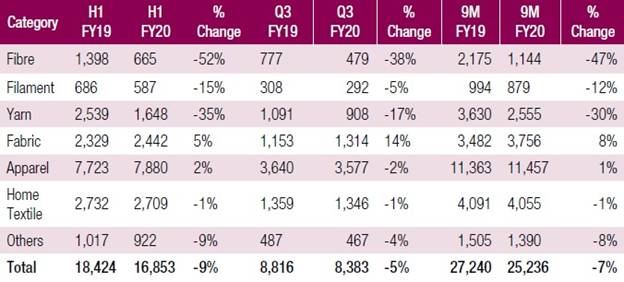
Source: DGCI&S
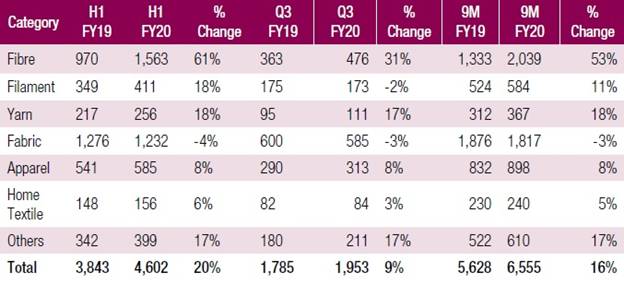
Textiles & Apparel Imports Increase by 16%
India’s textiles & apparel imports stood at $6.5 billion in 9M FY20, recording a growth of 16 per cent over 9M FY19. The imports of fibres and yarn experienced the highest growth of 53 per cent and 18 per cent, respectively, followed by that of filament with a growth of 11 per cent and apparel with a growth of 8 per cent. China and Hong Kong’s share decreased by 3 per cent in 9M FY20.
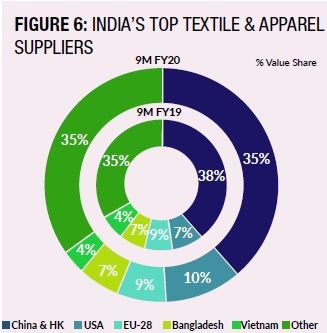
Table 2: India’s Textile & Apparel Imports
Source: DGCI&S

Textile & Apparel Imports of EU Increases, US Drops
The US imported textiles & apparel products worth $84.5 billion in 9M FY20, showing a decline of 1 per cent as compared to that in 9M FY19. With a value of $103.5 billion in 9M FY20, the textiles & apparel imports of the EU increased by 7 per cent as compared to same period in FY19. India’s exports to the US stood at $5.9 billion in 9M FY20, showing a growth of 3 per cent as compared to the previous financial year. For the EU, India’s exports were $6.5 billion in 9M FY20, showing an increase of 4 per cent over the previous financial year.
This article was first published in the April 2020 edition of the print magazine.


Comments