


European Union (EU's) imports declined m/m in April as member countries saw a dip in demand due to renewed surge in infections. Textile imports also fell and particularly imports of apparel and clothing were impacted largely by the geo-political tensions between EU and China. Imports from Bangladesh however continued to see strong growth.
Despite increasing economic confidence and rising demand, EU's imports from the world dropped to €166.0 billion in Apr-21. Recently released trade data shows that overall imports slacked for Apr-21, declining by 6.1 per cent m/m from last month's €176.8 billion, after growing strong m/m for the previous two months. Yet, imports remain higher than last year by 32.9 per cent, purely due to base effect, since Apr-20 was a watershed month for overall global trade. EU's overall exports also fell to €179.0 billion from €195.3 billion in Mar-21, declining by 8.3 per cent m/m, maintaining EU's overall trade surplus at €13 billion in April. Intra-EU imports also fell by 11 per cent m/m to €265.9 billion in Apr-21, from €298.6 billion in previous month.
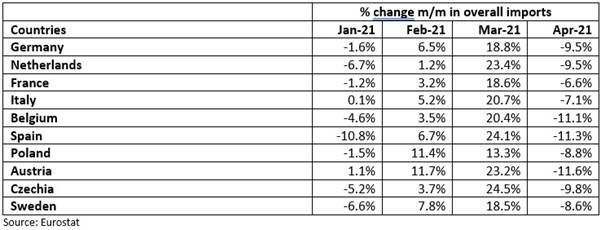
All major EU economies saw a fall in import demand in April. Germany's overall imports fell by 9.5 per cent m/m to €96.3 billion, making it the largest contributor to the fall in EU import demand. Netherlands, France and Italy also saw drop in import demand by 9.5 per cent, 6.6 per cent and 7.1 per cent respectively.
Table 1: Top 10 importing nations in the EU (import performance)
However, imports to EU did not see a uniform fall across all partner countries. While its major import partners China, United States and United Kingdom among others, saw a large m/m fall, partners such as India, Japan, Russia, Pakistan and Bangladesh saw continuous rise in exports to the EU. China's exports to the EU rose by an impressive 18.6 per cent m/m in March and fell subsequently by 11 per cent in April. Bangladesh's exports to the EU have risen consistently on a m/m basis, since Dec-20, and registered a 13.3 per cent growth in April. Similarly, India's exports to the EU have seen strong growth since Dec-20 and grew by 18.9 per cent in April.
Some of the decline in imports from China and the United States in April could be attributed to the port congestion there and on major European ports, Rotterdam and Antwerp, which has improved only recently. Renewed lockdowns in some of the EU countries were also partially responsible for this decline. Countries like France, Germany and Italy among others faced a third wave of COVID-19 infections and reinstated stricter lockdown measures for April. However, non-uniform impact on import demand of partner countries means that former could have been the more dominant factor.
EU's textile imports
This is a preliminary analysis of imports from major non-EU countries, as data for all non-EU trade partners and intra-EU textile trade isn't available yet. The set of countries considered here constitute more than 70 per cent of non-EU imports for EU in all categories, and therefore are enough to provide direction and for some categories, estimates for magnitude of change. Imports in all the three categories i.e fibres, yarn and fabrics and apparel & clothing saw a m/m decline in April, and imports of the latter two were more pronounced. Details of change in all three are discussed below:
Textile fibres
Figure 1: m/m change in textile fiber imports from selected countries
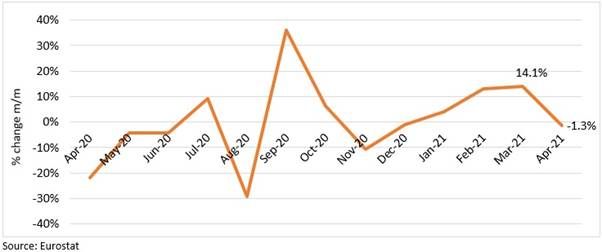
EU's textile fibre imports from the rest of the world fell marginally by 1.3 per cent in April, while imports from Bangladesh saw the sharpest rise. Intra-EU import figures are not released yet, but overall demand trend indicates a fall. However, that remains a speculation. Textile fibre imports from almost all major partners saw strong m/m growth, except Japan, Russia and the US. Fibre imports from China and India continued to rise m/m for the third consecutive month, registering 11.6 per cent and 42.3 per cent growth respectively in April. Imports from Turkey and Vietnam have also seen strong m/m growth, with 6.6 per cent and 11.6 per cent rise in April respectively.
Imports of cotton for the basket of countries saw a slight increase, with US seeing a robust growth. Among the large cotton importers to the EU, all except Turkey, saw rising cotton supplies to the EU in April. US cotton exports rose 39.7 per cent m/m, while those from India and Pakistan rose 22.3 per cent and 22.1 per cent respectively. Intra-EU imports of cotton are less relevant as they are only a quarter of EU's overall cotton intake from other countries.
Synthetic fibre imports continued their increasing run for the sixth consecutive month in April, rising by 5.6 per cent m/m. EU's imports from non-EU countries (rest of world) are almost 70 per cent of their overall synthetic fibre imports, however the historical trend for both appears to be similar. Imports of synthetic fibres from South Korea, Turkey and China increased by 0.9 per cent, 24.8 per cent and 29.8 per cent respectively, while those from US and Japan fell in April. Imports from India also saw a moderate increase of 4.3 per cent m/m.
The slight decline in overall fibre imports is perhaps because of falling imports of other man-made fibres, mostly artificial fibres such as rayon. For the select basket of countries, this category of fibres saw a 15.4 per cent m/m drop in April, with large source countries, US and Japan declining by 26.9 per cent and 3.9 per cent respectively. These two countries hold close to 50 per cent share of EU's imports of artificial fibres from rest of world. China, which has a relatively smaller share (13.0 per cent), saw a 20.2 per cent increase in its supplies of artificial fibres to EU. EU largely supplies its demand of artificial fibres internally, and these trends might not be reflective of the overall import demand.
Textile yarn and fabric
Figure 2: m/m change in textile yarn and fabric imports from selected countries
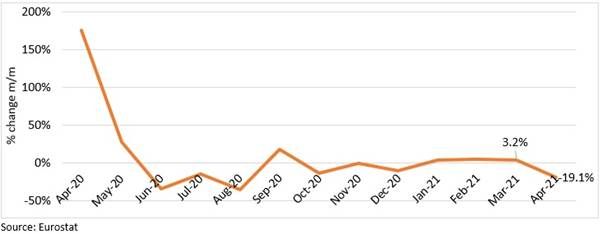
EU imports of textile yarns are almost equally supplied from within and outside the region. The selected group of countries constituted more than 78 per cent of its imports from rest of world. Textile yarn imports of EU rose marginally by 3 per cent in April. EU's major source of yarn imports--Turkey, China, and India, saw a sharp m/m rise by 17.1 per cent, 10.5 per cent and 30.3 per cent respectively. Yarn imports from South Korea dropped slightly by 4.6 per cent. Historical trend suggests that imports from intra-EU imports of textile yarn would have risen in April, as both intra-EU and extra-EU (rest of world) trade flows tend to move in the same direction.
EU imports almost equal value of cotton woven fabric from rest of world as it sources from within the region. Outside of EU, its imports of cotton fabrics fell m/m in April by 10.2 per cent with imports from China and Turkey falling. However, imports from Pakistan grew sharply by 19.1 per cent after remaining stagnant for the previous two months. Imports from India also grew by 15.2 per cent in April.
Imports of MMF woven fabric from rest of world fell sharply by 24.8 per cent, as imports from China saw a sharp drop of 33.2 per cent m/m. China constitutes more than 50 per cent supply of MMF fabric to EU from rest of world, and its exports have fallen for the second consecutive month this year. Again, historical trends of EU vs non-EU trade in MMF fabric are very similar directionally, setting expectations of an overall decline in MMF fabric imports for April. The decline however could be slightly muted than rest of world as the latter was skewed by imports from China.
For imports of other woven fabric, which involves fabric of wool, silk and artificial fibres, major sources saw a m/m decline in imports. China and India, which cumulatively constitute more than 35 per cent of rest of world imports of EU, fell by 27.5 per cent and 15.5 per cent respectively, while Turkey saw a slight increase of 1.5 per cent m/m in April. Imports of UK constitute almost 20.5 per cent of rest of world, so unavailable data for April makes estimation of actual decline of imports less useful.
Imports of knitted or crocheted fabrics to EU mainly come from within the region, and only close to 30 per cent comes from non-EU countries. Of the non-EU imports, China, Turkey and US cumulatively hold more than 55 per cent share. Imports from China in April fell sharply by 26.7 per cent over previous month, while those from Turkey fell only by 1.5 per cent. Imports from the US grew by 5.1 per cent.
A large segment of EUs textile imports is of made-up articles, where China continues to have a massive presence. Made-up articles of the selected countries (92.8 per cent share in EUs imports from rest of world), fell by 23.2 per cent, predominantly due to a steep 32.5 per cent fall in imports from China. This segment, a large part of which is usually home textiles, has seen imports from China fell for the second consecutive month this year. The scenario of made-up articles should however be seen in a different context. Imports from China of made-up articles, which also includes PPE suits and face masks, saw an astronomical rise last year beginning from Apr-20. The fall in imports in the recent month is perhaps a return to the usual trajectory for import of made-up articles from China.
Apparel & clothing
Figure 3: m/m change in apparel & clothing imports from selected countries
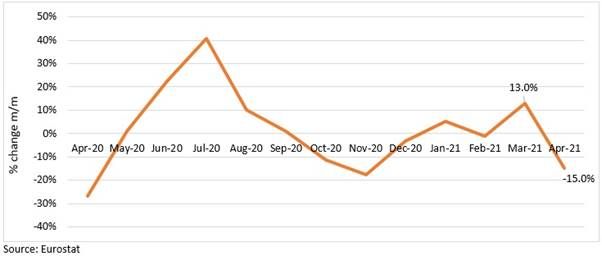
Apparel & clothing imports is the largest category of textile related imports for EU, valued more than €85.0 billion in 2019. China, Turkey, India and Bangladesh constitute more than 60 per cent of these imports of EU, and imports from the first three saw a sharp m/m drop in April, registering -28.2 per cent, -13.3 per cent and -8.7 per cent growth respectively. Imports of apparel & clothing from Bangladesh however continued to grow strong for the fourth consecutive month, registering a 13.4 per cent m/m rise in April.
Clothing imports dominate this segment, valued at more than €46 billion out of the €85 billion in 2019. Women's clothing takes up the largest share (32.6 per cent in 2019), while men's clothing takes up 22 per cent share. As mentioned for the entire category, imports of women's clothing from China, Turkey and India saw a decline, of 30.1 per cent, 13.2 per cent and 1.5 per cent respectively. Imports of women's clothing from Bangladesh have consistently risen on a m/m basis, registering 14.5 per cent rise in April. Similarly, for men's clothing imports from China and Turkey saw a decline of 33 per cent and 19.6 per cent respectively in April, while those from Bangladesh rose m/m for the fourth consecutive month by 15 per cent. In this category, Pakistan and Vietnam have a larger share than India, and hence bear greater relevance. Imports from Pakistan grew by 4.3 per cent m/m, moderating from 21.6 per cent growth in March, while imports from Vietnam declined by 17.6 per cent in April.
Imports of Other Articles of Apparel also saw a sharp decline by 16.6 per cent in April. Similar pattern continues here, as imports from China, Turkey and India fell by 34.6 per cent, 11.1 per cent and 13.5 per cent respectively, while those from Bangladesh grew by 11.9 per cent. A notable feature of the trade trends is that EU imports from Bangladesh, in categories where Bangladesh is a major importer, continues to grow while imports from China have seen a decline across the board.
Clothing accessories imports saw a 21.5 per cent decline in April, with China having the greatest impact. Imports from China fell by 28.1 per cent m/m, while those from Turkey and Pakistan, grew by -10.0 per cent and 10.1 per cent respectively. (see Annex-1 for commodity codes clarification)
Some underlying reasons behind the numbers
EU saw a m/m drop in imports in Apr-21, and particularly for textile related products. Large part of this drop came due to decline in imports from China, particularly in apparel & clothing segment. Interestingly, EUs textile yarn imports from China have risen, but apparel & clothing imports have fallen. Major yarn importers from China such as Italy, Germany, Belgium, Netherlands and Spain all saw a m/m increase in yarn imports, while major apparel importing nations saw a fall in apparel imports from China. Squaring this with the fact that European brands were shifting out of China for sourcing much of their apparel needs, this fact seems like an anomaly.
The anomaly is a straight consequence of the humongous share that China holds in some of the largest sub-categories of the catch-all group "textile yarn". Considering five largest categories of yarn which EU imports from rest of world, China had an average 29.1 per cent share in 4 of the top 5 categories, which constituted more than 30 per cent share of textile yarn imports of EU. These categories are as shown in the table along with shares of three largest sources of yarn for EU.
Table 2: Shares in EU imports of yarn categories
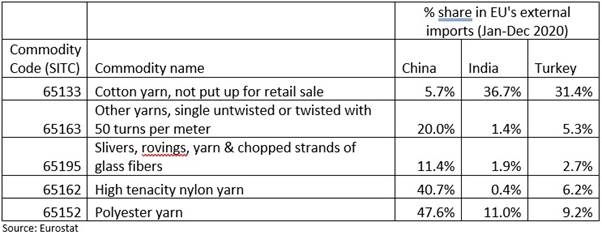
Cotton yarn constitutes the largest single category of EU yarn imports, and within that China held only a 5.7 per cent share in 2020 while India had a 36.7 per cent share and Turkey had a 31.4 per cent share. Where China holds the most share, in categories like other untwisted or twisted yarns, nylon yarns and yarns of glass fibre is where demand has also risen tremendously m/m. Cotton yarns were 19 per cent of EUs total yarn imports while the other four categories held close to a 30 per cent share. Imports of category 65163 from other sources like Japan and South Korea have only marginally increased or even fallen m/m, while from China these imports have risen on an average of 18.5 per cent in the last six months.
The easier shift in apparel sourcing vis-a-vis sourcing of yarn could be because of China's greater capacity in many yarn categories. Such competitive advantage has perhaps now been achieved by other countries as well when it comes to apparels. This then indicates that imports of yarn from China will be impacted only gradually, as compared to EU's imports of apparel from China.
Annex-1
According to SITC (Standard International Trade Classification) coding system, overall Apparel & Clothing category is coded 84, and the clothing sub-categories as mentioned in the text are coded as below:
841: Men's or boys' coats, capes, jackets, suits, blazers, trousers, shorts, shirts, underwear, nightwear and similar articles of textile fabrics, not knitted or crocheted.
842: Women's or girls' coats, capes, jackets, suits, trousers, shorts, shirts, dresses and skirts, underwear, nightwear and similar articles of textile fabrics, not knitted or crocheted.
843: Men's or boys' coats, capes, jackets, suits, blazers, trousers, shorts, shirts, underwear, nightwear and similar articles of textile fabrics, knitted or crocheted.
844: Women's or girls' coats, capes, jackets, suits, trousers, shorts, shirts, dresses and skirts, underwear, nightwear and similar articles of textile fabrics, knitted or crocheted.
The term "other articles of apparel" is category code 845 which is labelled as "Articles of apparel, of textile fabrics, whether or not knitted or crocheted, n.e.s." and includes items like babies' garments, swimwear, jerseys, track suits and garments made of rubberised and other special textile fabrics.
Clothing accessories is category code 846 and is labelled as "Clothing accessories, of textile fabrics, whether or not knitted or crocheted (other than those for babies)"


Comments