20240830145908.gif)


Global trade has slowed since 2012 relative both to its strong historical performance and to overall economic growth. An analysis of the forces behind the recent growth slowdown in the volume of international trade by World Economic Outlook 2016, reveals that a major driver is slower growth in aggregate demand, particularly in investment, responsible for generating international trade flows in the form of capital goods and intermediate inputs. Reduced pace of trade liberalisation measures and the return of some protectionist measures and retraction of global value chains explain the slowdown in trade growth, writes Anjuli Gopalakrishna
Global trade growth has slowed down significantly in recent years. After its sharp collapse and even sharper rebound in the aftermath of the global financial crisis, the volume of world trade in goods and services has grown by just over 3 per cent a year since 2012, less than half the average rate of expansion during the previous three decades.
The slowdown in trade growth is remarkable, especially when set against the historical relationship between growth in trade and global economic activity (Figure 2.1). Between 1985 and 2007, real world trade grew on average twice as fast as global GDP, whereas over the past four years, it has barely kept pace. Such prolonged sluggish growth in trade volumes relative to economic activity has few historical precedents during the past five decades.
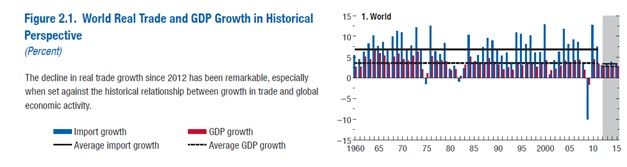
Source: IMF staff calculations. Note: Imports include goods and services. The charts are based on an unbalanced sample of 100 countries in 1960 and 189 in 2015. Annual aggregate import (GDP) growth is calculated as the weighted average of country-specific real import (GDP) growth rates, where nominal import (GDP at market exchange rates) shares are the weights used.
Is the waning of trade simply a symptom of the generally weak economic environment, or is it an outcome of a rise in trade-constricting policies?
Find comprehensive analysis & detailed reporting on related subjects here.
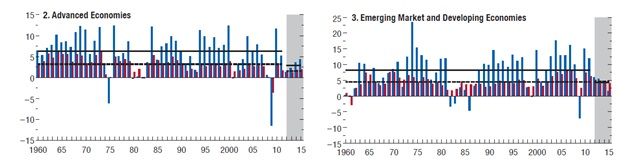
The World Economic Outlook 2016 reveals that the decline in real trade growth affected most of the countries between 2012-2015, either in absolute terms or relative to GDP (gross domestic product) growth. Trade growth fell for both goods and services, although services trade slowed less. Among goods, trade growth fell for 85 per cent of product lines, with the sharpest slowdown in trade in capital and intermediate goods.
Subdued investment growth, the China effect and protectionist measures
WEO analysis suggests that, for the world as a whole, up to 75 per cent of the decline in real goods import growth between 2003-07 and 2012-15 can be traced to weaker economic activity, most notably subdued investment growth. Investment slowed down significantly in many emerging markets and developing economies, including in China, which has been focusing more on domestic consumption and services-led growth rather than focusing on investment and trade.
The slowdown in the pace of trade liberalisation and the recent rise in protectionist measures are holding back international trade in goods, even though the impact may not be significant yet. An overall decline in the participation and growth of global value chain is also an important factor contributing to the trade slowdown.
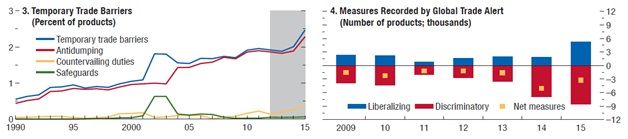
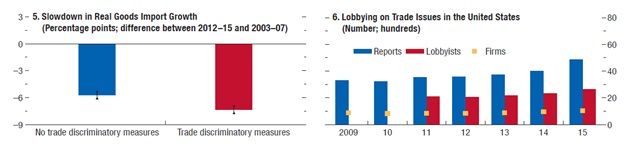
Evidence from the Global Trade Alert-currently the most comprehensive database for all types of trade-related measures imposed since the global financial crisis-shows a steady increase in protectionist measures since 2012, with 2015 recording the largest number of harmful trade measures. There seems to be clear evidence that the real import growth of products due to trade discriminatory measures experienced a deeper decline in 2012-15 relative to 2003-07 (Figure 2.10, panel 5). An increase in a firm's lobbying activity is also an additional indicator of the businesses' concerns and anxieties related to trade issues.
Role of trade costs and global value chains
The term 'trade costs' includes a range of factors that occur between the exporter's producer price and the consumer prices in the importing country. These include transportation costs and tariffs, availability and cost of trade credit and other harder-to-quantify elements such as language barriers, regulations, etc.
Find comprehensive analysis & detailed reporting on related subjects here.
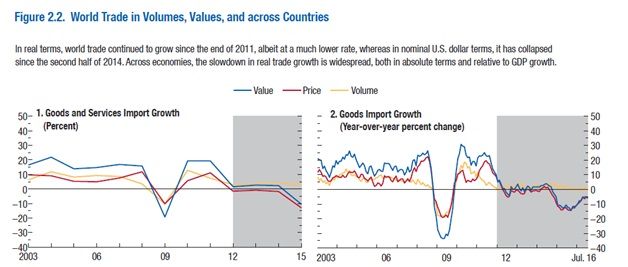
The global average manufacturing costs in the world's 10 largest importers declined significantly during 1990-2008, spiked with the retrenchment in international trade during the global financial crisis and flattened thereafter (Figure 2.9, panel 1). The same pattern can be observed across economies and sectors (Figure 2.9, panel 2). While more dispersed, the decline in trade costs was substantially larger for emerging market and developing economies which face much higher trade costs, than for advanced economies over this period (Figure 2.9, panel 3 and 4).
Sources: Eora Multi-Region Input-Output database; and IMF staff calculations. Note: The index follows the Head and Ries (2001) and Novy (2012) methodology to understand how trade costs in a broad sense have evolved over time. These costs are inferred from the patterns of observed bilateral trade, production, and absorption across countries.
Find comprehensive analysis & detailed reporting on related subjects here.
The FTA effect
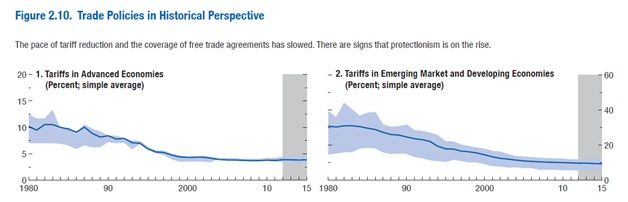
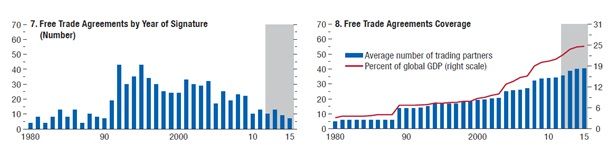
Free trade agreements can also reduce trade costs, not only by curtailing tariff and nontariff barriers but also by including provisions on various other issues that may hinder trade in goods and services, for example, regulatory cooperation. The expansion and spread of free trade agreements was particularly strong in the 1990s, averaging nearly 30 signed agreements a year, per the Design of Trade Agreements database. In the run-up to the global financial crisis, the number dropped slightly (to 26), but since 2011 the rate has fallen sharply to about 10 agreements signed a year (Figure 2.10, panel 7).
Sources: Bown 2016; Design of Trade Agreements database; Evenett and Fritz 2016; Global Trade Alert database; Ludema, Mayda, and Mishra 2015; United Nations Conference on Trade and Development Trade Analysis and Information System; World Bank Temporary Trade Barriers database; World Trade Organization (WTO) Tariff Download Facility; WTO Regional Trade Agreements database; and IMF staff calculations.
Find comprehensive analysis & detailed reporting on related subjects here.
However, compared with earlier pacts, recent agreements are deeper-they cover a much broader coverage of issues and measures than tariffs alone. And unlike earlier arrangements, they include more trading partners-for example, the recently negotiated mega regional Trans-Pacific Partnership (TPP), the Regional Comprehensive Economic Partnership (RCEP), and the Transatlantic Trade and Investment Partnership (TTIP), which are still being negotiated. Such arrangements encompass large groups of countries with a major share of world trade and foreign direct investment. Such deeper and larger agreements tend to have a bigger impact on trade growth. The TPP faces uncertainty given Trump's rise to Presidency in the United States. So also, the real impact and outcome of Brexit remains to be seen.
The transportation and logistical trade costs
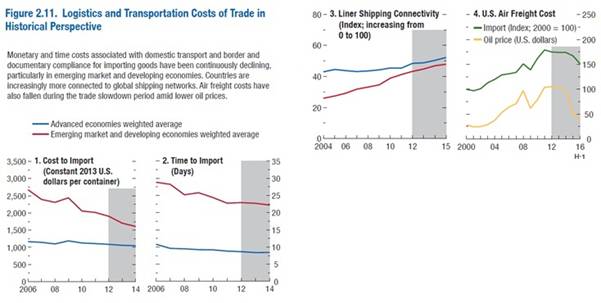
Transportation and logistical trade costs have been continuously declining since 2006. Both the monetary cost about the logistics of trade, such as documentary compliance fees and movement of goods to ports and borders, and the time involved in this process have significantly fallen in emerging market and developing economies since 2006 (Figure 2.11, panels 1 and 2). These costs have remained flat in advanced economies at their already low levels. Countries are also increasingly connected to global shipping networks, as shown in the size of their maritime fleets, container-carrying capacity, and so forth (Figure 2.11, panel 3).
An exception to this pattern is air freight costs, which rose steadily between 2002 and 2012, but have since fallen during the trade slowdown on the back of lower oil prices. The decline in oil prices since 2014 has likely lowered the cost of other modes of transport as well. However, time pattern of international transportation and logistical costs of trade indicate that they probably did not contribute to the decline in the growth rate of global trade.
Sources: United Nations Conference on Trade and Development (UNCTAD); U.S. Bureau of Labor Statistics; World Bank, Doing Business Indicators; and IMF staff calculations.
Find comprehensive analysis & detailed reporting on related subjects here.
The way forward
The WEO analysis concludes that sizeable share of global trade slowdown is attributable to changes in trade policy and to the slowing expansion of the global value chain. Empirical analysis suggests that for the world, up to 3/4th of the decline in trade growth since 2012 relative to 2003-07 can be predicted by weaker economic activity and most notable subdued investment growth. Changes in the composition of demand account for about 60 per cent of the slowdown in growth rate of nominal imports relative to GDP. However, factors beyond this are also weighing on trade growth. Particularly, trade policies and global value chain participation account for sizable share of the unpredicted shortfall in annual global trade growth. The pace of new trade policy initiatives at global level has slowed down notably. At the same time uptick in protectionist measures is impacting the trade growth.
Many emerging market and developing economies maintain or face trade barriers that inhibit their entry into global markets and participation in global production chains.
A coordinated effort to remove such barriers could kick off a new round of integration and global value chain development and provide firms with greater incentives to invest. More broadly, avoiding protectionist measures and reviving the process of trade liberalisation through trade reforms that lower barriers, coupled with measures that mitigate the cost to those who shoulder the burden of adjustment, would boost growth in the international exchange of goods and services and ultimately strengthen global activity. However, given the recent Brexit vote in the UK and the rise of Trump to power in the US makes one wonder what shape the global policies will take in the years to come.
Anjuli Gopalakrishna (www.anjulig.com) is an apparel sourcing industry professional who is passionate about change, innovation and technology. Gopalakrishna writes about the latest trends, insights, tips and tricks related to the apparel and fashion industry.
Find comprehensive analysis & detailed reporting on related subjects here.


Comments