


Production at the Agarpara Jute Mills Ltd at Kamarhati in Kolkata was badly affected from March 22 to the second week of May due to the lockdown. In the spinning department, actual production /frame, number of machines running in shifts and daily spinning production continued to fall after the lockdown was over. The main reason is shortage of skilled manpower due to temporary migration. In both fine and coarse side spinning, though daily production fell in March-April, it rose beginning June. In April, the unit was totally closed. After May, production has been increasing in the weaving section. Thread wastage and sliver wastage are also rising after May. Delivery status of Hessian cloth, sacking bags and jute yarn exhibited the same trend. After May, despatch quantity has improved.
Introduction
The lockdown has left the Indian jute sector with an estimated loss of ₹1,250 crore. Forty lakh farmers and three lakh jute mill workers are associated with the industry in West Bengal, and the sector contributes ₹6,500 crore to the state's gross domestic product. The pandemic has badly hit India's exports markets, including the United States and the European Union, causing order cancellations and deferrals and leading to unsold inventory and higher working capital requirements. The lockdown led to factory closures and worker lay-offs. Mills manufacturing jute sacking bags, an important material under the Essential Commodities Act, 1955, were soon made exempt from the lockdown and were allowed to resume production. The study deals with the effect of the pandemic on the daily production of the jute industry. Agarpara Jute Mills Ltd. in West Bengal was selected for the study
Objective
• To find out the extent of the effect of the pandemic on this factory's productivity.
• To observe the effect of the lockdown on dispatch of finished goods to customers.
The jute mill industry employs over 6 lakh workers, with 95 per cent being contractual ones, mainly from Bihar and Uttar Pradesh who settled in Bengal over the years. On March 20, the Indian labour ministry advised all private and public sector units not to terminate employees, particularly casual or contractual ones, or reduce their wages. Jute mills usually work throughout the year and some have diversified into other jute products, but the industry as a whole is still totally dependent on jute bag production. At present, 42 jute mills, mostly located in the North 24 Parganas district, are ready to resume operations. West Bengal is the country's largest producer of jute sacks, producing 12.2 lakhs metric tonnes every year. Jute mill authorities say that they have no alternative but to wait and watch.1
The West Bengal administration imposed a twice-a-week lockdown in the state till August to stem the rise in COVID-19 cases. However, it allowed the mills to function if those housed workers inside their premises before a lockdown day began. The notification created some problems for the 50-odd operational jute mills in the state. Apart from additional expenses incurred on housing workers inside the premises, there was a risk of the spread of infection among the workers. After being shut on March 24, the mills were finally allowed to fully operate from June 1. However, the industry is facing a shortage of labour as many workers have returned to their hometowns during the lockdown, causing production to be insufficient to meet the government demand.2
Jute is an important natural fibre crop cultivated in about 4 million hectares in India. Jute contributes around ?1,000 to ?1,200 crore annually to India's export revenue. During the on-going pandemic, the procurement is lesser than normal. As a result of the rise in demand for jute bags, there was an increase in the price of these bags. But the effect of COVID-19 on the prices of raw jute in the markets was not explored as most of the concerns were directed towards the jute industry and workers. There was a significant relationship between market price and market arrival during the pandemic. As the quantity of jute arrived increases, its market price decreases.3
Results and discussion
Table 1 and Table 2 represent the productivity status of fine and coarse side of the spinning department. Figure 1 describes the variation of monthly average production in million tonnes (MT) of fine and coarse side of spinning department. The graph shows daily production decreased gradually from February to March. In April, the mill was closed and as a result, there was no production activity. Production restarted in the first week of May. Target and actual production rose from May to June. A similar trend was observed in case of coarse side spinning machines as well. The average daily production in MT of the fine side was much higher than coarse side due to higher number of machines allocated to the fine side. Coarse side means only sacking weft in this mill. Very few machines are running here and as a result, MT value is lower in this area.
Table 1: Productivity analysis of fine side spinning frame (figures are monthly average)
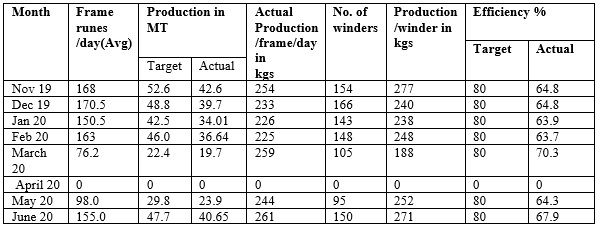
Source: Productivity report book of Mill
Table 2: Productivity analysis of coarse side spinning frame (figures are monthly average)
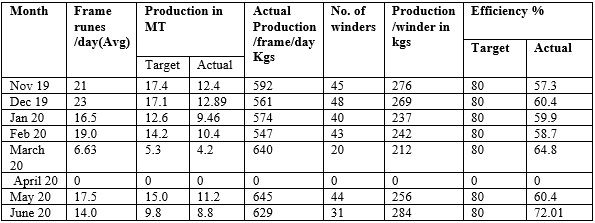
Source: Productivity report book of Mill
Figure 1: Target VS actual monthly average production of fine and coarse side spinning department
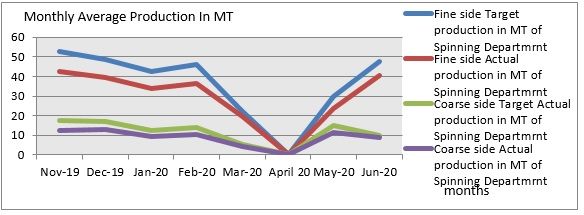
Figure 2 represents the percentage of variation of average spinning efficiency of target and actual over various months in the fine and coarse side. It was found that both fine and coarse side target spinning efficiency are superimposed, i.e., 80 per cent in both the cases. Both spinning efficiency percentage varied the same way over different months. After May, both the curve exhibited a rising trend. The lower efficiency of coarse side spinning is due to inferior batch composition, which results in a higher spinning yarn breakage rate compared to fine-side yarn.
Figure 2 Target VS actual monthly average efficiency percentage of fine and coarse side spinning department
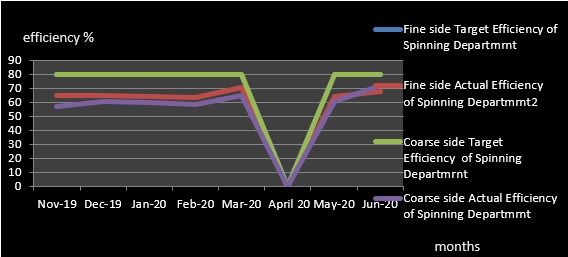
Figure 3 indicates the actual production/frame/day of fine and coarse side of different month. Obviously, due to heavier count of the yarn, coarse side production/frame/day in kg are higher than those of fine side. A similar trend is observed in the two curves. In April, due to the lockdown, both the curve touched the X axis as the mill was closed. In case of fine side production, it again increased from May to June, whereas the reverse is observed in coarse side spinning’s
Figure 3: Actual production/frame/day of fine and coarse side spinning department
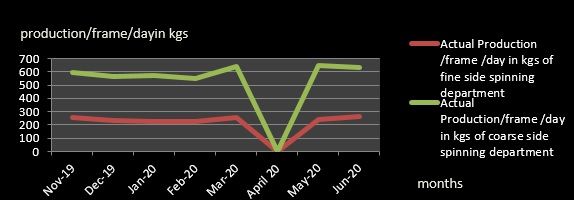
Figure 4: Production per winder in kg/shift of fine and coarse side spinning department
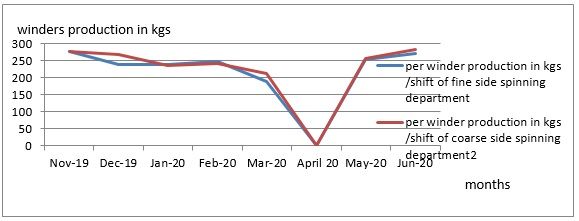
Figure 4 represents the variation of per winder production in kg/shift of both the fine and coarse side. Coarse side production/winder is slightly higher than fine side in some months. After May, production per winder increased in both fine and coarse sides as productivity increased; more number of employees joined work. The number of winder increased in June, it was observed.
Table 3: Study of weaving department productivity, Period: November 2019 to May 2020
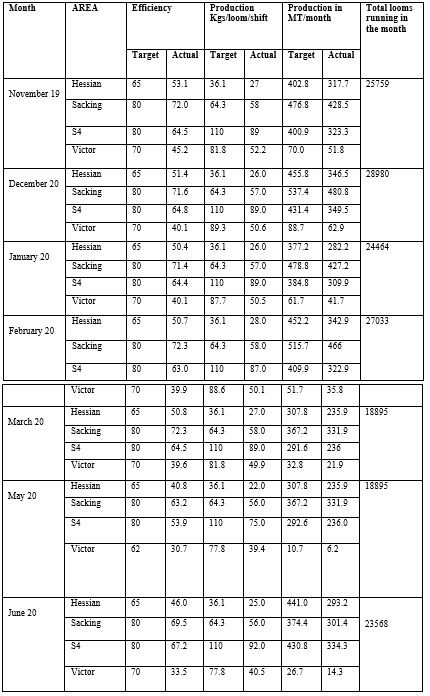
Source: Productivity report of mill
Table 03 represents the productivity parameters of weaving department: efficiency (monthly average) and production in kg/loom/shift (monthly average). Total monthly production in MT of four different machine group and total loom running in that particular month are mentioned. Hessian, sacking, S4 and victor are the four areas classified to observe the productivity parameters separately. Table 3 and Figure 5 represent the total number of running looms in each month. The graph shows that from February this year, the lines show decreasing trend and fall to zero in April. From May, it again shows an increasing trend. From March 20 to the first week of May, the factory was closed, resulting in heavy financial losses.
Figure 5 Variation of the total number of monthly loom running
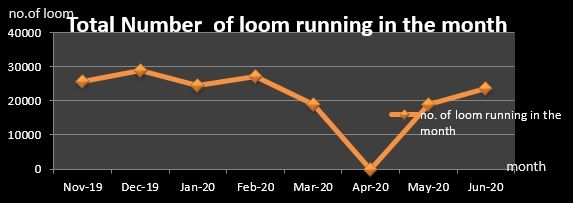
Figure 6: Variation of Hessian loom efficiency (target versus actual)
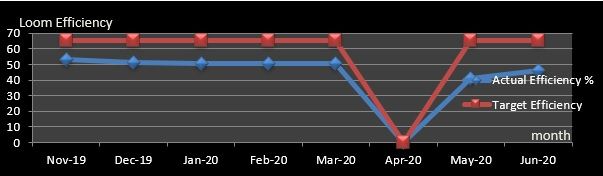
Figure 6 explains the target and actual efficiency of Hessian loom and its variation over months. The monthly average efficiency decreased and touched the X axis in April due to factory closure. From May, when it started further increasing, a wider difference is observed between target and actual efficiency due to lesser number of machines running and unskilled machine operators.
Figure 7: Variation of sacking loom efficiency over different month, (target vs. actual )
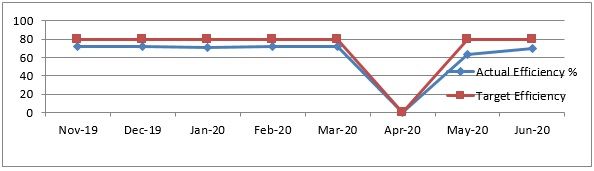
Figure 8: Variation of S4 loom efficiency (target vs. actual)
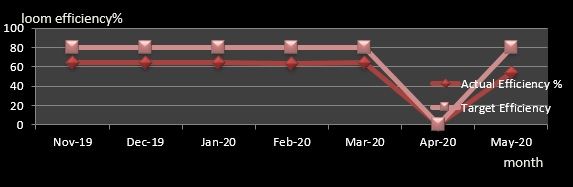
Figure 9: Variation of Victor loom efficiency (target vs. actual)
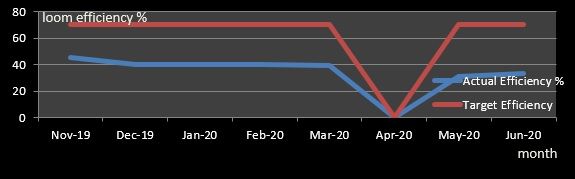
Similarly, Figure 7 represents the graph for sacking looms, Figure 8 for S4 and Figure 9 for Victor loom machines’ monthly average machine efficiency and their variation over months. A wider difference was observed between target and actual efficiency percentage in case of Victor loom both after and before the lockdown. After the lockdown, the loom efficiency of Victor loom was much higher due to absence of supervisors, lower yarn quality and poor machines condition.
Figure 10 and Figure 11 represent the kg/loom/shift of Hessian and sacking loom over months. The trend is similar in both. There was no production during the lockdown period. In case of sacking loom, the difference between actual and target kgs/loom/shift is narrower than that in Hessian loom. That is due to the higher number of machines, heavier yarn count and heavier fabric weight.
Figure 10: Variation of kg/loom/shift of Hessian loom (target vs. actual)
Figure 11: Variation of kg/loom/shift of sacking loom (target vs. actual)
Figure 12: Variation of kg/loom/shift of S4 and Victor loom (target vs actual)
Figure 12 represents the variation of kg/loom/shift of S4 and Victor looms. Target and actual production/loom/shift are always higher in case of S4 loom due to heavier fabric and higher yarn count.
Figure 13 represents the monthly total production of Hessian and sacking loom and its variation. The actual production of sacking loom/month is always higher than Hessian loom due to heavier fabric and higher yarn count due to the lockdown. Both graphs touched the X axis in April.
Figure 13: Variation of monthly total production in MT (target vs. actual ) Hessian and sacking quality
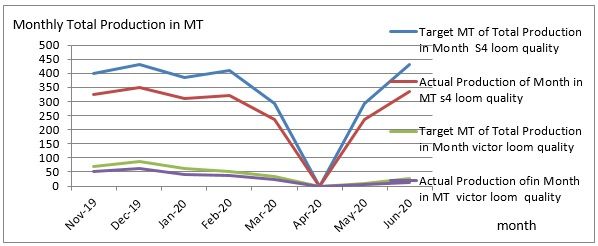
Figure 14: Variation of monthly total production in MT (target vs. actual ) S4 and Victor loom
Figure 14 represents the monthly total production of S4 and victor loom and its variation. Both target and actual production of S4 loom are higher than those in Victor loom. That was due to higher number of operational S4 looms, higher yarn count and heavier fabric.
Process wastage details
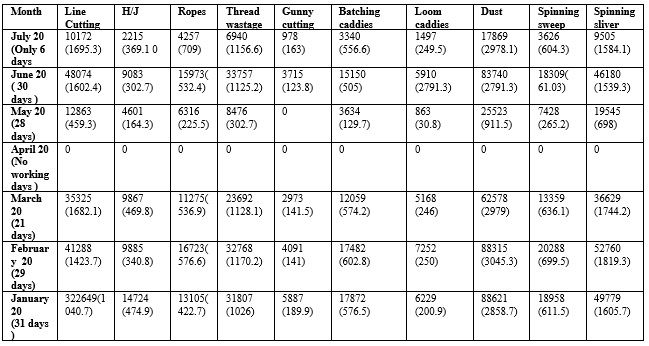
Table 4: Total wastage (in kg) of processing from January to July 2020; figures within brackets indicate average wastage per day
Source: Thread wastage Registered book of the mill
Table 4 indicates the process of various sources over months. Due to the lockdown, waste generation was nil as indicated in Table 1. All waste were recycled and used for processing. Only thread wastage and sliver wastage are taken into consideration as some value is associated with such wastage. Gunny cuttings, ropes, H/J, line cuttings are used in processing.
From Figure 15, it is observed that thread wastage increased gradually from January to February, and then decreased and became nil in April. From May to July, it again increased. If we consider the conversion cost of yarn from jute fibre as ₹10,000/MT, we can conclude that there was financial loss following the thread wastage curve. It is nearly ₹11,000 per day financial loss for thread wastage. Thread wastage is recycled and reprocessed, but it incurs additional cost for further processing.
Figure 15: Variation of thread wastage (average/day) from January to July 2020 (figures in kg)
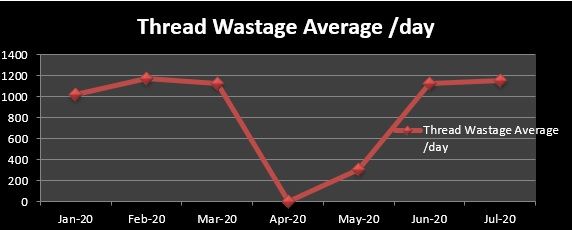
Figure 16: Variation of spinning sliver (average /day)
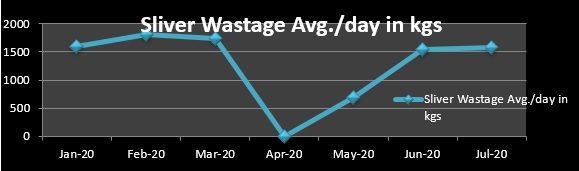
Figure 16 represents the variation of sliver wastage perday. Financial loss is associated with this type of waste. Sliver wastage follows the same trend as that of thread wastage. During the lockdown period, there was no production, and therefore, no sliver wastage and no financial loss. From May, it started showing an increasing trend. Table 4 shows 1.83 per cent (average) of spinning production is the thread wastage per day.
Table 4 also describes the various sources of thread wastage generation over different dates and shifts. The generation of thread wastage has been studied from January 23 to February 3 this year. Table 1 shows thread wastage from weaving and finishing department occurred in each shift every day. The spinning and winding departments’ thread wastage occurred in the batching department in the A shift, except three days when it happened in the B shift.
Impact of COVID-19 pandemic on dispatch status in this unit
The COVID-19 pandemic led to a lot of financial loss in the jute industry. We have studied the production and delivery status of various jute finished goods during the pre- and post-lockdown periods. Table 5 and Figure 1 describe the production and delivery status of Hessian jute goods. Both the number of bales and quantity in kg are represented in Table 5. Figure 1 shows production of Hessian goods and the respective delivery in number of bales gradually decreased beyond February and achieved a lower minimum in April, which was under complete lockdown. In that month, though production was quite negligible, delivery did take place. Stocks of finished bales of Hessian quality were delivered during this period. Delivery quantity was lower minimum in May. After that, production and delivery gradually increased as most of the labour force had joined back by then.
Table 5: Production and delivery status of Hessian cloth
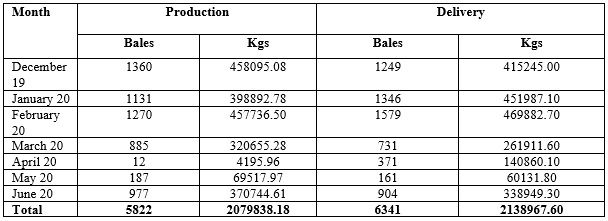
Source: Registered book of the mill
Figure 17: Production versus delivery status of Hessian cloth
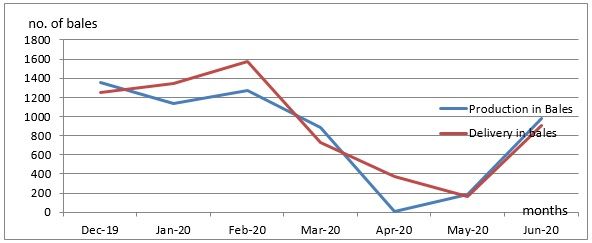
Table 6: Production and delivery status of sacking bags
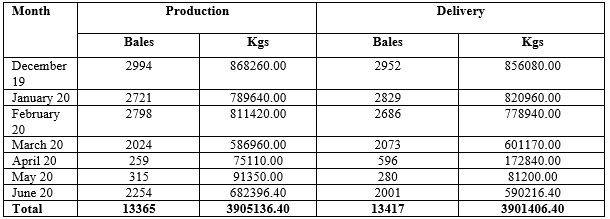
Source: registered book of the mill
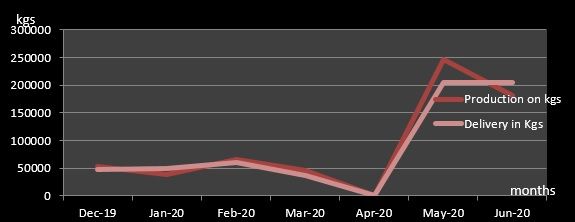
Figure 18: Production versus delivery status of sacking bags
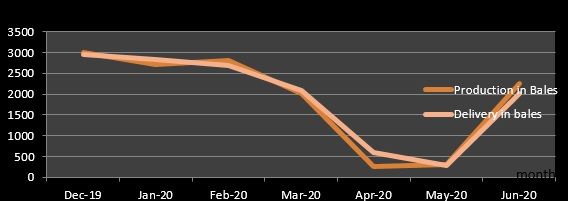
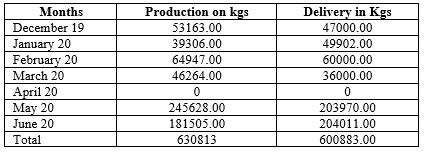
Table 6 and Figure 2 explain the production and delivery status of sacking bags. Both production and delivery were low in March, April and May. June onwards, as regular work of the mill was started, both production and delivery of sacking bags started increasing.
Table 7: Production and delivery status of jute yarn
Source: Registered book of the mill
Table 7 and Figure 3 indicate the quantitative production and delivery status of jute yarn. From February to April, the production and delivery quantity fell and reached zero. From May, these gradually increased. This was a good sign. Now the industry is running in full capacity. Productivity is in full swing as employees are regular at the workplace. Three shifts are running well. Machines are running in each shift with full production target and standard production is now being achieved. Economy of the locality is entirely dependent on this industry. The local economic environment has now come back to its pre-pandemic state. A lot of ancillary units dependent on this industry are also thriving now.
Figure 19: Production versus delivery of jute yarn
Workers at the Agarpara Jute Mills Ltd factory are now fine after being back to their jobs. The management has taken several measures to safely run the unit. The demand for jute products is now enhanced due to freshly arriving crop. The requirement of jute bags is now urgent in many states. The industry is now running in full swing implementing safety measures.
During the nation-wide lockdown and closure of the factory, despatch of finished goods was affected, with huge financial losses. After that, the unit gradually returned to normal operations.
References:
1. Singh G,( April 21, 2020 ), COVID-19 underlines crisis in jute mills in Kolkata suburbs, https://citizenmatters.in/kolkata.
2. PTI, (22nd July 2020 ), COVID-19 woes: Bi-weekly lockdown in Bengal may affect its jute industry, https://www.newindianexpress.com/cities/kolkata.
3. Logesh. M, Paul Mansingh. J and Nisha. A, (May 2020), Effect of COVID-19 Pandemic on the Market Price of Jute in India, https://www.agriculturejournal.org,volume8,number2.
4. Acharya N ,( April 15, 2020 ), Covid-19: Jute mills seek more relaxation to meet Rabi packaging demand, https://www.business-standard.com/article.
5. PTI , (March 28, 2020 ), COVID-19: Jute mills seek exemption to operate during lockdown, https://retail.economictimes.indiatimes.com/news/industry.
6. Singh S S ,( APRIL 15, 2020), COVID-19 lockdown , Bengal government allows operation of jute mills with 15% staff, https://www.thehindu.com/news/national.
7. Thakur J and Bhattacharya S, (Apr 22, 2020), Covid-19: 50 jute mills ask for permission to operate, only 5 get it in West Bengal, https://www.hindustantimes.com/india-news.
8. PTI, (MAY 12, 2020), Jute Industry Incurs Rs 1,250 Crore Loss Due to Coronavirus-induced Lockdown, , https://www.news18.com/news/busines,
9. Ravi S, (April 2020), Covid 19 Impact On Textile Exports, http://www.businessworld.in/article
10. Juneja A,( Apr 2020 ), COVID-19 Lockdown: Impact on Textile Industry, https://www.fibre2fashion.com
11. Ghosh K,( Apr 07, 2020. India's textile industry reeling under COVID-19 impact, https://www.moneycontrol.com/news.
12. Subramani- M R, (May 1, 2020) , Post-Covid-19 Scenario: India Is A Major Producer Of Natural, Man-Made Fibres But Textiles Industry Facing Hurdles In Taking Advantage Of Global Anti-Chinese Sentiment, https://swarajyamag.com.
13. Khan F H, (April 26, 2020 ), COVID-19 Pandemic: Choppy Waters ahead for the Golden Fiber, https://www.lightcastlebd.com.
14. More A (. June 26, 2020), Jute Products Market 2020 by Global Industry Trend, Size, Share, Competition, Growth, SWOT Analysis, COVID-19 Impact, Capacity and Future Forecast till 2020 to 2025 ,at MarketReportsWorld.com, https://www.marketwatch.com.


Comments