


The WPI (wholesale price index) for the 'textiles' group increased by 1.4 per cent to 141.6 (provisional) from 139.6 (provisional) for the previous December year-on-year (YoY) comparison. This increase was mainly due to the rise in cotton textiles (3.7 per cent), which is a major component in the textiles group. A Fibre2Fashion report
Prices always fluctuate for all commodities, and the wholesale price index (WPI) represents the average wholesale price movement of some select commodities. The commodities are selected by the government on the basis of those that are more important in terms of market share at a time, and can represent the entire economy. The WPI gives the idea of price movement in the market. The Indian government decides its important economic and financial policies based on the WPI. In India, the WPI is used by the government, banks, industries and businesses. The three major groups in the WPI of India are: (i) primary articles (food, non-food and minerals), (ii) fuel, power, light and lubricants (coal, mineral oils, electricity), and (iii) manufactured products (food, textiles, leather, wood, paper, rubber, chemicals, beverages, etc).
For the WPI, data is collected on a voluntary basis at present. The price data for primary articles and fuel and power are obtained by government ministries and departments. For manufactured products, the data is obtained from different government sources and top manufacturing units. The data is compiled by the office of the economic advisor, and published on a monthly and yearly basis. The government revises the WPI series from time to time. The WPI of the new series [with base year 2004-05] was launched on September 14, 2010. A total of 676 commodities have been selected, and the number of price quotations is 5482. Among textile commodities, the total number of price quotations is 457 which includes all major products including subsidiary products of cotton textiles, manmade textiles, woollen textiles and others.
1. WPI of textile groups
The textiles sector is a major contributor to the Indian economy. The textiles industry provides employment to 105 million people directly or indirectly. The GDP (gross domestic product) contribution of the textiles sector is around 5 per cent. The investment in textile industry is approximately $108 billion. The three main groups of the industry are considered in WPI: cotton textile, manmade textile and woollen textile. The WPI for the 'textiles' group increased by 1.4 per cent to 141.6 (provisional) from 139.6 (provisional) for the previous December year-on-year (YoY) comparison mainly due to the rise in cotton textiles (3.7 per cent), which is a major component in the textiles industry in India.
Fig 1.1 WPI of Textile Group Year-on-Year (YoY) comparison between 2015 and 2016
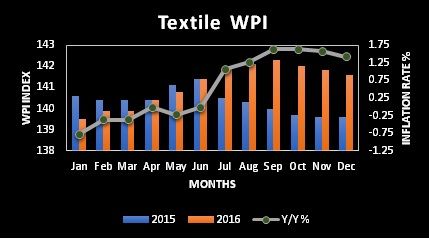
Source: Economic Advisor of India
As shown in above graph, WPI of textile products went down till May compared to previous year. During June WPI remained similar for 2015 and 2016. From July to December WPI is observed dramatically higher than previous year. Similar trend has been seen in cotton textile as cotton textiles are contributing around 70 per cent of the total textile sector. The weight age of cotton textile is higher among all the product of textile group.
1.1 Cotton textiles
Fig 1.2 WPI of Textile Group Year-on-Year (YoY) comparison between 2015 and 2016
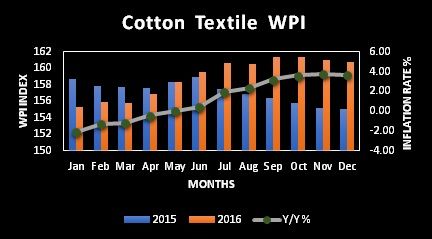
Source: Economic Advisor of India
In period of January-May, the WPI of cotton textiles declined YoY whereas from June-December the wholesale price moved up YoY. Cotton textile WPI increased by 3.68 per cent in December 2016. In 2016, cotton prices increased due to a strong demand from Pakistan for import of cotton from India. There are strong buying sentiments for cotton textiles in the domestic market leading to an increase in the wholesale price of cotton.
1.2 Manmade textiles
Fig 1.3 WPI of Textile Group Year-on-Year (YoY) comparison between 2015 and 2016
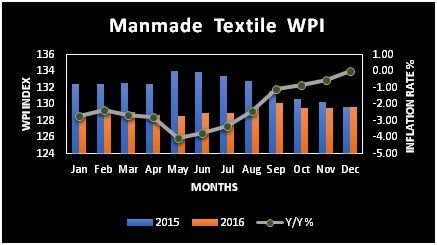
Source: Economic advisor of India
The wholesale price for manmade textiles decreased during the period of January-November YoY. While the WPI remained flat in December, 2016, the WPI of manmade textiles edged lower due to lower manmade fibre prices and less significant movement in manmade fabric prices.
1.3 Woollen textiles
Fig 1.4 WPI of Textile Group Year on Year(YoY) comparison between 2015 and 2016
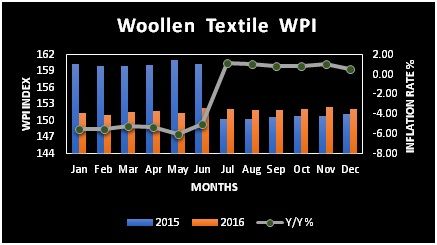
Source: Economic Advisor of India
The WPI of woollen textiles moved down by a large amount till June YoY. From July onwards, the wholesale price increased, but by a small margin. The woollen textile WPI increased by 0.60 per cent in December 2016. Wool prices soared during January-June 2015 due to an increased demand from China. China is the largest importer of wool and exporters of readymade woollen garments. Wholesale prices of woollens textile rose first and then settled down. The WPI range varied around 150-160. For 2016, the woollen textile WPI assessed in the range of 151-152.5.
2. Correlation between cotton yarn and cotton fabric
Cotton fibre is always preferable for Indians due to weather conditions and traditions. The relationship between cotton yarn and cotton fabric is positive. The correlation co-efficient is 0.35. The wholesale price for cotton yarn and cotton fabric is related as well. If there is any change in cotton yarn prices, it will affect the cotton fabric price too.
Fig 2.1 WPI of Cotton Yarn Year-on-Year (YoY) comparison between 2015 and 2016
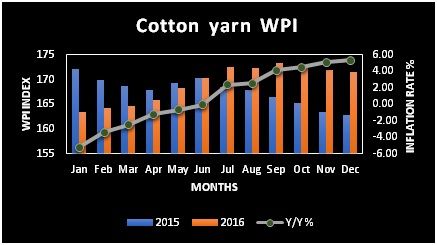
Source: Economic advisor of India
In period of January-May, the WPI of cotton yarn textiles declined YoY whereas from July-December wholesale prices surged YoY. The cotton textile WPI increased by 5.41 per cent in December 2016.
Fig 2.2 WPI of Cotton Textile Year-on-Year (YoY) comparison between 2015 and 2016
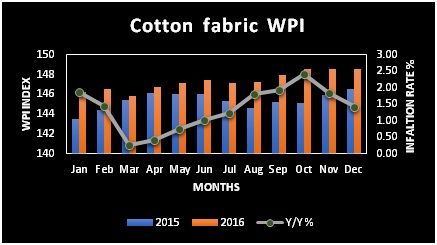
Source: Economic Advisor of India
For cotton fabric, the wholesale price improved in 2016 compared to 2015 for all the months. The WPI of cotton fabric increased by 1.43 per cent in December 2016 YoY.
3. Correlation between manmade fibre and manmade fabric
The relationship between manmade fibre and fabric is positive and strong. The correlation coefficient is 0.75. The wholesale price of manmade fibre moved down throughout the year in 2016 compared to 2015 for all months. The WPI of cotton fabric decreased by 0.16 per cent in December 2016 YoY.
3.1 WPI of Manmade Fibres Year-on-Year (YoY) comparison between 2015 and 2016
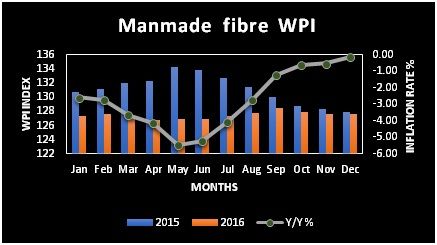
Source: Economic Advisor of India
In manmade textiles, polyester is a major polymer. Manmade fibre prices moved down due to lower crude oil prices and continuous fall in polyester prices. The raw material for manmade fibre is dependent on the crude oil prices movement, while for manmade fabric, intermediate stages are involved. In India, labour costs are low comparatively, so different profit margins are obtained, though they are related.
Fig 3.2 WPI of Manmade Fabric Year-on-Year (YoY) comparison between 2015 and 2016
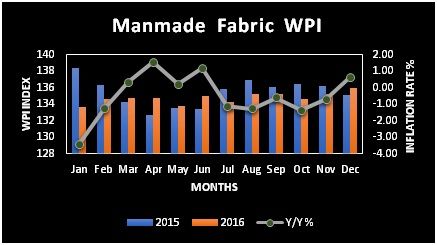
Source: Economic Advisor of India
For manmade fabric, the mixed trend of wholesale price movement can be seen from the graph for 2016 compared to 2015 for YoY. The WPI of cotton fabric increased by 0.67 per cent in December 2016 YoY.


Comments