20240830145908.gif)


The overall sales of top textiles companies have increased marginally, and earnings before interest, tax, depreciation and amortization (EBITDA) margins declined significantly.
The findings are from the Wazir Textile Index (WTI) comprising cumulative financial performance of the top ten Indian textile companies along with update on market performance of Indian textiles sector for the nine months (April-December) of FY18 (9M FY18).
Based on detailed financial analysis, the WTI Sales index was calculated to be 108.5 in 9M FY18 as compared to 107.9 in 9M FY17. This indicates that the overall consolidated sales increased by 1 per cent during April-December this year.
Figure 1: WTI Sales Figure 2: WTI EBITDA
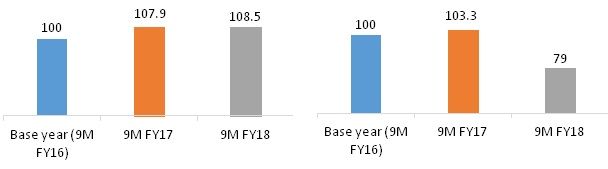
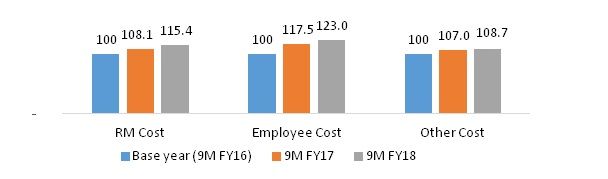
However, EBITDA declined drastically by 24 per cent. Consolidated WTI EBITDA stood at 79 in 9M FY18 as compared to 103.3 in 9M FY17. Due to introduction of the goods and services tax (GST), there was an impact on demand in Q2 which further impacted the profitability of major textile players in 9M FY18. Also, there has been increase in employee cost and raw material cost during this period thereby adversely affecting EBITDA margins.
Figure 3: WTI Cost
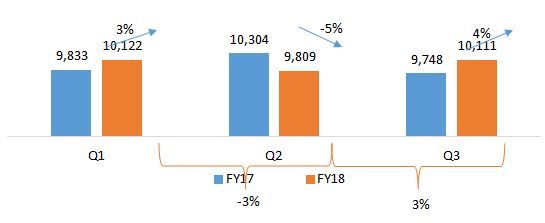
However, performance has rebounded in Q3 after a dip in Q2. Just after the introduction of GST, there was a dip in consolidated sales. However, in Q3 the sales and EBITDA levels improved for the textiles industry. On a consolidated level, sales increased by 3 per cent in Q3 vs Q2 FY18, after a dip of 3 per cent in Q2 vs Q1 FY18. Compared to the previous year, sales increased by 4 per cent in Q3 FY18 vs Q3 FY17, after a decrease of 5 per cent in Q2 FY18 vs Q2FY17.
Figure 4: Quarterly Consolidated Sales (Rs Cr)
Source: Moneycontrol
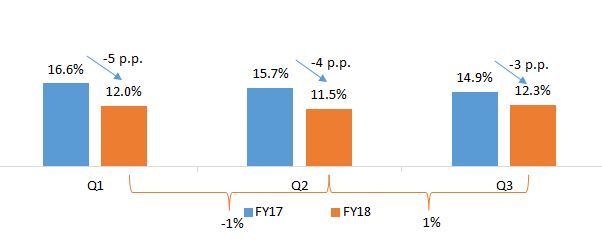
Consolidated EBITDA margins declined consistently in Q1 FY18, Q2 FY18 and Q3 FY18 compared to the previous year. However, the decline was less in Q3 FY18 at around -3 percentage points. Within FY18, average EBITDA margins declined in Q2 to 11.5 per cent and then further rebounded in Q3 to 12.3 per cent.
Figure 5: Quarterly Average EBITDA %
Source: Moneycontrol
Industrial production for textiles & apparel declines
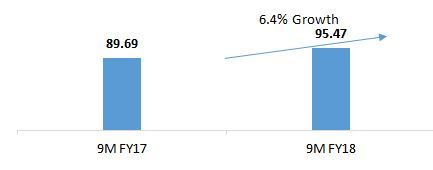
India's real GDP has grown by 6.4 per cent in 9M FY18 compared to 9M FY17.
Figure 6: India's GDP at constant prices*(Rs. Lakh Cr.)
Source: Reserve Bank of India
* Base Year 2011-12
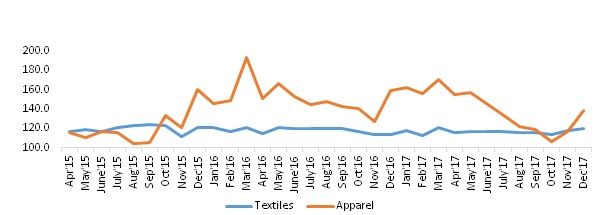
The average IIP (index of industrial production) for textiles has declined by 1 per cent and that for apparel by 10 per cent in 9M FY18 compared to 9M FY17. Decreased IIP may be attributed to lower market demand immediately after GST introduction, especially for apparel which saw significant decline in production. However, IIP has shown an upward trend in later part of Q3, suggesting revival.
Figure 7: Index of Industrial Production (IIP*)
Source: Reserve Bank of India
* Base Year 2011-12
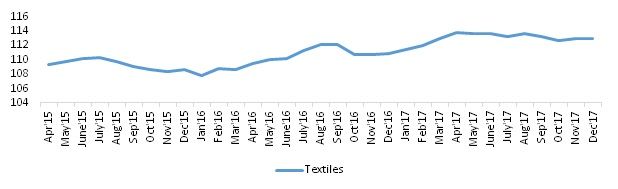
Due to the increase in raw material prices, the average WPI for textiles has shown an increase of 2 per cent in 9M FY18 compared to 9M FY17.
Figure 8: Wholesale Price Index (WPI*)
Source: Reserve Bank of India
* Base Year 2011-12
Exports see slight increase in 9M FY18
Indian exports of textiles and apparel products stood at $27 billion in 9M FY18, increasing by 3 per cent as compared to same duration last year.
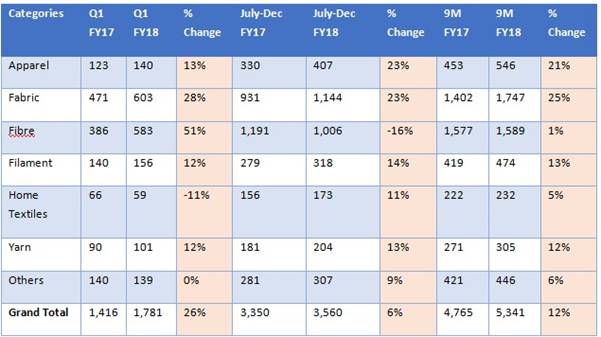
Table 1: India's Textile & Apparel Exports (US$ million)
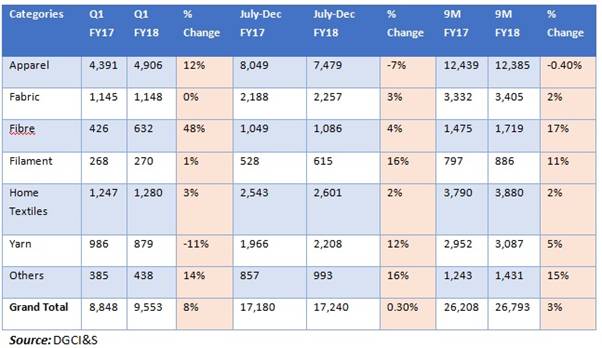
Exports of all the categories have grown in 9M FY18 as compared to 9M FY17, except apparel. India's apparel exports increased by 12 per cent year-on-year (y-o-y) in Q1 FY18. However, the same declined by 7 per cent in Q2 and Q3, resulting in overall stagnation. Fibre exports grew significantly at 17 per cent in 9M FY18 driven by cotton fibre exports' growth of 24 per cent. Fibre exports slowed in Q3 after a robust Q1, while yarn exports have shown a reverse trend. India's overall exports grew 10 per cent y-o-y during 9M FY18 compared to 3 per cent for the T&A sector.
Table 2: India's Top Export Markets
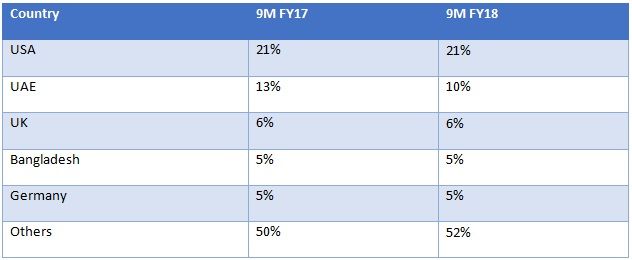
Source: DGCI&S
The US and UAE continue to be the two largest export markets with a cumulative share of ~30 per cent. India's imports of T&A products are on a rise after introduction of GST, especially for fabric and apparel. Imported textiles and apparel products were worth $5.3 billion in 9M FY18, registering a growth of 12 per cent as compared to 9M FY17.
Table 3: India's Textile & Apparel Imports (US$ mn)
Source: DGCI&S
The imports of all categories have increased in 9M FY18. Fabric imports have increased the most in 9M FY18 (25 per cent) compared to other categories. Apparel imports have also grown significantly by 21 per cent in 9M FY18, especially after GST (23 per cent growth). The increase in apparel imports is a cause for concern and needs to be addressed.
Table 4: India's Top Import Markets
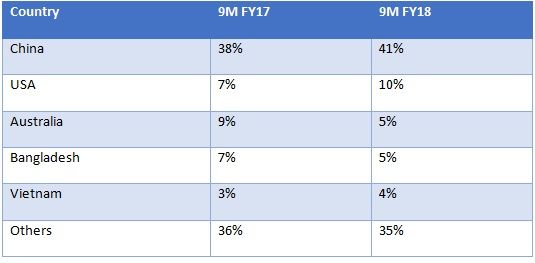
China continues to be the largest import partner for India. The import share of the US has increased significantly from 7 per cent to 10 per cent, primarily due to increase in cotton imports. The US imports of T&A increased by 3 per cent in the April-December 2017 period, while EU imports increased by 5.8 per cent during April-November 2017. Among the top import countries, Vietnam has shown high growth of 9 per cent in US imports, while China and India have increased by 3 per cent. US imports from Bangladesh have declined by 4 per cent.
Figure 9: Overall Imports and Top Import Countries of USA (US$ Bn)
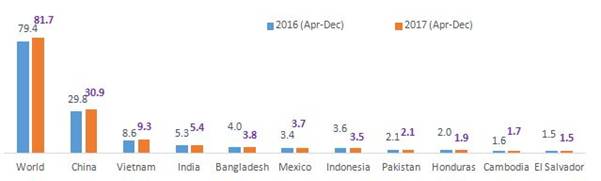
Source: OTEXA
Vietnam has shown high growth of 8.8 per cent in imports of EU. Other top countries showing high import growth to EU include Pakistan (11.9 per cent), Cambodia (14.6 per cent), Morocco (8.8 per cent) and Bangladesh (5.9 per cent). China has grown 4.1 per cent, while India has shown a lower growth of 3.6 per cent. India's lower growth compared to competing nations shows further increasing competition in export market for India.
Figure 10: Overall Imports and Top Import Countries of EU-28* (US$ Bn)
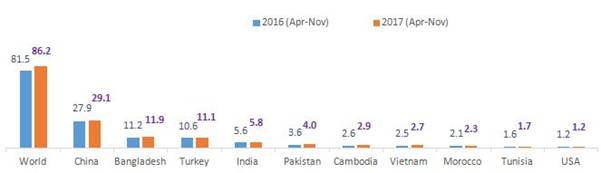
Source: EUROSTAT
*EU-28 data excludes intra EU trade
Despite fluctuations, raw material prices increase
Overall, there has been an increase in raw material prices in 9M FY18 compared to 9M FY17. On an average basis, raw cotton, viscose staple fibre and polyester staple fibre prices increased by 4 per cent, 10 per cent and 11 per cent respectively in 9M FY18.
Figure 11: Fibre Prices (Rs. /kg)
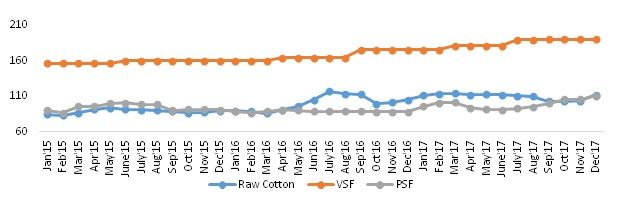
Source: Ministry of Textiles
Similarly, there has been an increase in cotton yarn and polyester viscose blended yarn average prices growing at a rate of 5 per cent and 6 per cent respectively in 9M FY18. However, polyester cotton blended yarn has registered a decline of 6 per cent in 9M FY18 compared to 9M FY17 on an average. However, the same grew by 0.2 per cent during Q3 FY18.
Figure 12: Yarn Prices (Rs. /kg)
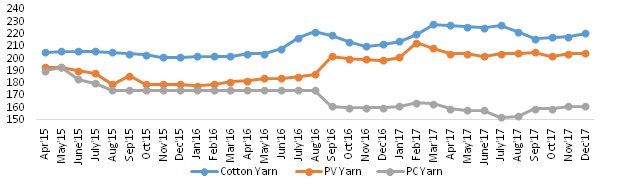
Source: Ministry of Textiles
Conclusion
Overall, the Indian textiles and apparel industry has struggled during nine months of FY 18 in terms of profitability. However, sales performance has grown marginally with higher increase in Q3. The overall performance has rebounded in Q3, which remains promising for the future.
Exports have grown at a slow rate with a stagnant growth in apparel exports primarily as a result of increasing competition from other countries. Also, India's apparel and fabric imports are on a rising trend especially since introduction of GST. This signifies a threat to domestic manufacturers and needs to be addressed with appropriate interventions.


Comments