


In recent years, the US has employed Section 301 to target China’s trade practices. With China being a major player producing a significant portion of the world’s textiles and apparel, the global fashion garment industry has been particularly affected. The significant and far-reaching impact has not been limited to companies in the US and China and can also be seen in other countries that rely on these two nations for production and trade.
What is Section 301?
Section 301 of the US Trade Act of 1974, last amended March 23, 2018, authorises the President to take all appropriate action, including tariff-based and non-tariff-based retaliation, to obtain the removal of any act, policy, or practice of a foreign government that violates an international trade agreement or is unjustified, unreasonable, or discriminatory, and that burdens or restricts US commerce.
Simply put, section 301 authorises the US President to take any action he wants based on any reason he may have.
The Sino-American trade war began in August 2017. The balance of trade with China having reached $383 billion, President Donald Trump imposed punitive tariff increases on 1,000 products totalling $250 billion. At that time, garments were excluded from the punitive tariffs. In August 2019, Trump added punitive tariffs on imports on a further $300 billion of imports from China. This time garments were included.
What were the effects of the new punitive tariffs on garment imports from China?
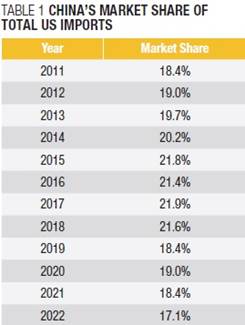
As we can see from the Table 1, China’s US market share fell from 21.6 per cent in 2018 to 17.1 per cent in 2022 – a decline of 20.8 per cent.
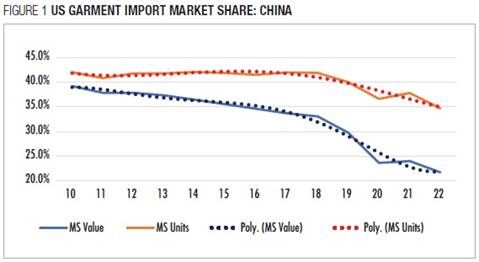
China’s garment market share also fell. As we can see from Figure 1, the situation is somewhat nuanced. China’s US import market share as measured by value has been falling for well over a decade, while market share as measured by units remained steady from 2010 through 2018, at which point it fell from 41.9 per cent to 34.7 per cent, a decline of 17.1 per cent. In both cases market share declines moderated considerably in 2021 and 2022.
Clearly, while China still remains the US’ number 1 supplier both for all products as well as garments, market share did decline in the period following the imposition of punitive damages.
Who are the winners and losers?
Vietnam
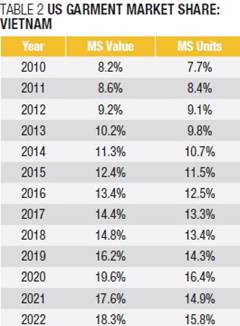
As we can see from Table 2, Vietnam has done very well. For the period following the imposition of punitive damages on China’s garment exports, market share (MS) by value moved from 16.2 per cent to 18.3 per cent, an increase of 12.9 per cent, while market share in units moved from 14.3 per cent to 15.8 per cent, an increase of 10.8 per cent.
Bangladesh
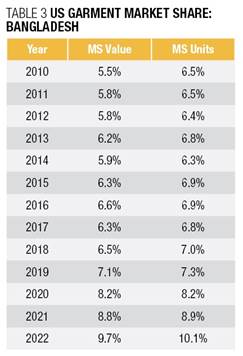
As we can see from Table 3, Bangladesh has also done very well. For the period following the imposition of punitive damages on China’s garment exports, market share by value moved from 7.1 per cent to 9.7 per cent, an increase of 37.6 per cent, while market share in units moved from 7.3 per cent to 10.1 per cent, an increase of 38.8 per cent.
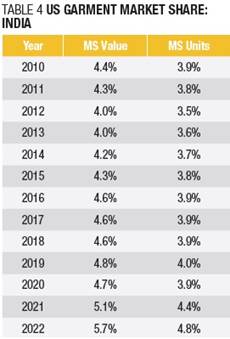
India
As we can see from Table 4, India has done well. For the period following the imposition of punitive damages on China’s garment exports, market share by value moved from 4.8 per cent to 5.7 per cent, an increase of 17.3 per cent, while market share in units moved from 3.9 per cent to 4.8 per cent, an increase of 19.1 per cent.
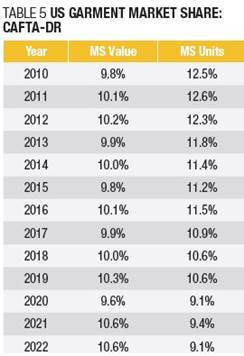
CAFTA-DR
As we can see from Table 5, the CAFTA-DR region has not done well. For the period following the imposition of punitive damages on China’s garment exports, market share by value moved from 10.3 per cent to 10.6 per cent, an increase of 2.8 per cent, while market share in units moved from 10.6 per cent to 9.1 per cent, a decrease of 14.1 per cent.
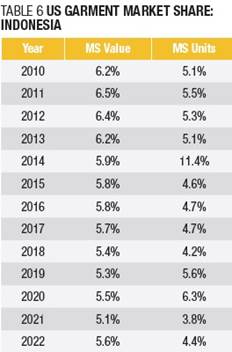
Indonesia
As we can see from Table 6, Indonesia has not done well too. For the period following the imposition of punitive damages on China’s garment exports, market share by value moved from 5.3 per cent to 5.6 per cent, an increase of 6.7 per cent, while market share in units moved from 5.6 per cent to 4.4 per cent, a decrease of 20.6 per cent.
While the data appears to be clear, there are a number of problems
The period 2019-2022 is quite exceptional. The industry faced a number of exceptional problems which may have accounted for changes in imports and market share.
• The year 2020 brought the COVID-19 pandemic, which reduced both US garment imports as well as garment retail sales.
• The year 2022 was the year of chaos, where during the first half retailers greatly increased imports as well as fob prices, and this was followed by a disastrous period of retail sales collapse.
Under the circumstances, it is very difficult to determine the actual effects of the section 301 punitive duties imposed by trump.
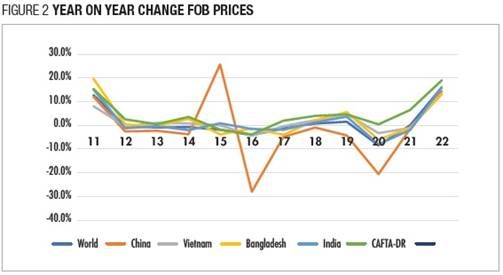
As we can see from Figure 2, (with the exception of china 2015-2107) FOB prices remained remarkably steady until 2019. The subsequent year 2020 brought a severe drop in FOB prices across the board. This, in turn, was followed by an equally remarkable increase in FOB prices also across the board. Under the circumstances there is every possibility that the section 301 punitive tariffs were paid for by the American consumer in the form of higher retail prices.
However, by far the greatest problem is that with regard to fashion garments the punitive damages were totally irrational.
Countries increase tariffs for three reasons, none of which makes sense in this situation.
• To reduce imports in order to increase local production: the problem here is that the US has virtually no domestic garment industry, and therefore cannot increase domestic market share.
• To increase revenue: the problem here is that as we have seen above, any increased revenue was more than offset by either increased costs on the part of the domestic retailer or increased retail prices. At the end of the day, there was no revenue benefit, and simply added costs were paid either by the retailer or passed on to the consumer.
• To move production from China to more favoured exporting countries: if that was the goal then the China punitive tariffs failed. Of the largest garment suppliers, only CAFTA-DR with its free trade agreement could be considered a favoured supplier. As we have seen above, from the period 2019-2022 CAFTA-DR lost 20.6 per cent of their orders, compared with China’s loss of 13.2 per cent.
Actually, for the US government there was no way out.
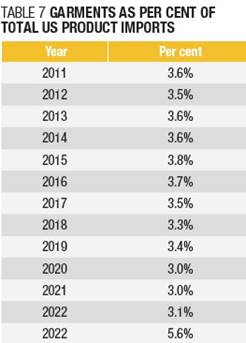
As we can see from Table 7, garments represent only 3 per cent of total US imports.
The most rational decision would be to forget about the problem and drop the punitive tariffs on garments. However, this is not possible because politicians on all sides are on record against China. Alternatively, if the us government truly wished to undermine China’s position as their greatest supplier, they could enter into a series of free trade agreements (FTA) with Asia (TPP) and the EU.
The view from the supplier side
Garment exporting countries, their industries and their factories all suffer from two common misnomers. First, the fashion garment sector is to a large degree an extension of the commodity garment sector, and second, as a result Bangladesh, India, Cambodia etc will all compete against one another for China’s lost market share.
In the real world, the relationship between commodities and fashion is similar to the relationship between a bicycle and a motorcycle, where to some degree the purpose may be similar, but the products have little in common.
In industry, success in the commodity sector is all about direct costs: Wage rates, FOB prices, tariffs etc. We can therefore expect that the Trump punitive tariffs will render China’s commodity exports less competitive.
However, success in the fashion sector has relatively little to do with direct costs, which is why the EU is the world’s largest fashion garment exporter.
As China’s commodity factories lose orders, we should expect these factories to move from commodities to fashion, with the result that China’s fashion sector will become larger, stronger, and more competitive.
Going forward, rather than Bangladesh, India, Cambodia etc competing against one another for China’s lost market share, all will have to compete against a resurgent China-based fashion garment industry. Herein lies the problem: NONE ARE ABLE TO COMPETE AGAINST CHINA BECAUSE CURRENTLY ALL LACK THE ABILITY TO COMPETE.
To put it another way, the customer must continue to import fashion goods from China, even at higher prices, because there is no Asian alternative.
If Asian garment exporting countries, their industries, and their factories wish to compete with China, they must offer the customer the same advantages offered by China. Since there are no short cuts, it will require a massive effort in both time and capital.
Therefore, the first and most important question facing each garment exporting country is whether the effort makes economic sense. Would it not be easier to invest in other more sophisticated industrial sectors? Historically, almost every successful Asian economy has begun with garment exports, only to move to other higher value-added industries.


Comments