


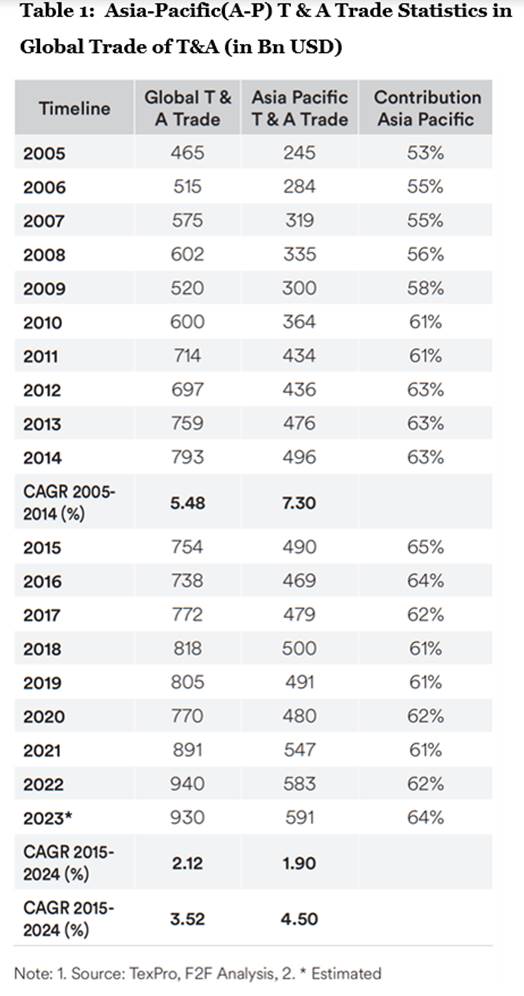
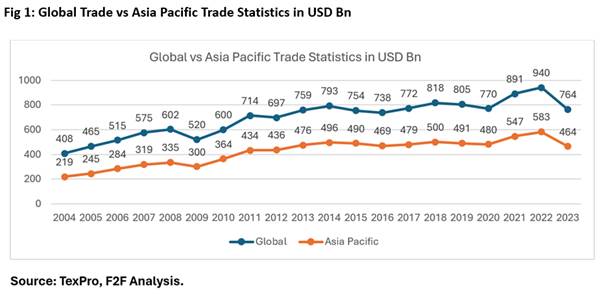
The Asia Pacific region has historically been a cornerstone in shaping the global trade of textiles and apparel (T&A), serving as a primary sourcing destination worldwide (Fig 1). Following the abolition of the Agreement on Textiles and Clothing (ATC) on January 1, 2005, the global T&A trade experienced rapid expansion, accompanied by increased exports from the Asia Pacific region. Notably, the growth rates in the Asia Pacific region have outpaced global trends, boasting a compound annual growth rate (CAGR) of 4.5 per cent over the last two decades, compared to the world's more sluggish average growth rate of 3.52 per cent during the same period.
In the first decade post-ATC, the T&A trade witnessed a significantly high growth rate, reaching 5.48 percent globally, while the Asia Pacific region registered an impressive 7.30 percent during the same period. Throughout this timeframe, the Asia Pacific region's contribution to global T&A trade steadily increased, rising from 58 percent to 63 percent. However, despite maintaining a contribution above 60 percent to world trade, the Asia Pacific region has recently experienced a downturn due to the disruptions caused by the COVID-19 pandemic and regional conflicts.
The textile trade, both globally and within the Asian region, experienced robust growth until 2020, with minor fluctuations attributed to factors such as raw material prices or specific policies. However, the landscape shifted dramatically in the aftermath of the COVID-19 pandemic and the Russia–Ukraine war, which destabilized global and regional trade. The war, coupled with increased fuel prices, triggered widespread inflation, exacerbating cost-of-living crises, and prompting significant expenditure cuts among consumers. Given that textile purchases are often discretionary, consumer spending reductions led to a sharp decline in orders from major markets, resulting in decreased exports from Asian nations.
Furthermore, internal issues within the region compounded these challenges. Countries like Bangladesh and China faced concerns regarding wages, working conditions, and economic uncertainty. China, in particular, experienced economic downturns attributed to factors such as the collapse of the real estate market and a decline in manufacturing output. These internal challenges further impacted regional textile trade, contributing to significant fluctuations in trade volumes between 2020 and 2023.
Assessing Country-Level Competitiveness in Asia Pacific
Textiles, Apparel, and Home Textiles
Below, we analyse the growth, competitiveness, and market shares of the top 13 countries in the Asia-Pacific region to better understand the dynamics of trade in textiles, apparel, and home textiles over 8 years. The countries under scrutiny include China, Bangladesh, Vietnam, India, Pakistan, Indonesia, South Korea, Hong Kong SAR, Cambodia, Japan, Thailand, Australia, and Sri Lanka. We segment the products into Textiles (HS 50-60), Apparel (HS 61-62), and Home Textiles (HS 63).
Textiles
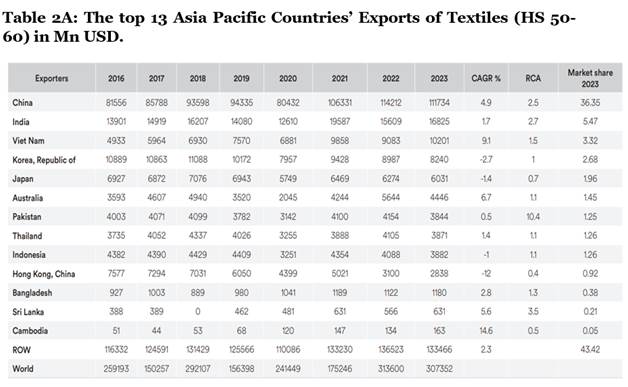
The production and export of textiles, apparel, and home textiles by China have dominated the global market. In textiles, China corners a share of 36.35 per cent followed by India (5.47 per cent), Vietnam (3.32 per cent), the Republic of Korea (2.68 per cent), Japan (1.96 per cent), Australia (1.45 per cent) and Pakistan (1.25 per cent), Thailand and Indonesia share 1.26 per cent each. China not only maintains its position as the market leader but also demonstrates consistent growth year on year. India's global export share fluctuates between 9 per cent to 11 per cent over the same period, displaying stability in its market presence. Similarly, the Republic of Korea follows a similar pattern.
While market shares typically follow a predictable pattern, the Compound Annual Growth Rate (CAGR) reveals some intriguing insights. Cambodia, despite having a minimal global export share, boasts the highest CAGR of 14.6 per cent. This indicates that, relative to its previous years, Cambodia is on a significant growth path, albeit from a small base compared to other countries. Following closely is Vietnam with a CAGR of 9.1 per cent, demonstrating both a significant market share and an impressive growth rate, positioning Vietnam competitively in the market.
Australia, Sri Lanka, and China exhibit respectable CAGRs of 6.7 per cent, 5.6 per cent, and 4.9 per cent respectively, indicating consistent growth over the past seven years. Analysing the fluctuations in export share across these countries over time will provide deeper insights into the nuances of their performance.
The countries which have experienced negative growth rates in the last eight years are Hong Kong (-12 per cent), the Republic of Korea (-2.7 per cent), Japan (-1.4 per cent), and Indonesia (-1 per cent), it's evident that these nations have indicated declines in their exports to the world. Among them, Hong Kong has witnessed the most significant contraction, with a low market share and Revealed Comparative Advantage (RCA), suggesting it's not a viable sourcing option for textiles. Almost all countries in the top 13 list show comparative advantages other than Japan, Hong Kong, and Cambodia. An RCA greater than 1 indicates that these countries would benefit from continued production and export of these products.
Considering all factors examined, it appears that Australia, China, India, and Vietnam possess a competitive edge or comparative advantage over other Asia-Pacific countries in the Textiles (HS50-60).
Apparel
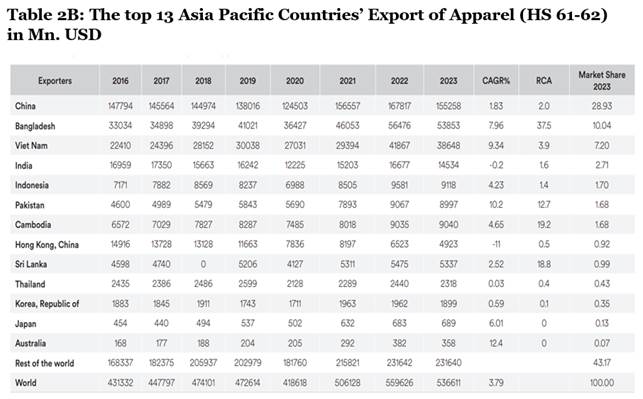
In the apparel segment, the exports from 2016 to 2023 have been examined, focusing on metrics such as export market share in 2023, Compound Annual Growth Rate (CAGR), and Revealed Comparative Advantage (RCA). China leads the pack with a substantial 30 per cent share of global exports in 2023, accompanied by a respectable CAGR of 1.83 per cent and an RCA of 2.0. Bangladesh follows closely, commanding a 10 per cent market share with an impressive CAGR of 7.96 per cent and a robust RCA of 37.5, indicating strong competitiveness on the global stage.
Vietnam’s fashion industry corners a 7.5 per cent market share, a high CAGR of 9.34 per cent besides showing a strong revealed comparative advantage (3.9) over their counterparts in the global arena. while India captures 3 per cent global market shares of fashion exports and declining growth rates, though it has a good RCA of 1.6 indicating a competitive advantage in its exports.
The most prominent countries that control around 1.7 per cent of the global fashion trade are Indonesia, Pakistan, and Cambodia. The interesting features of both Pakistan and Cambodia are their significant growth rates and their advantages in the fashion trade as compared to their counterparts. The revealed comparative advantage of Cambodia is highest in the top 13 countries of Asia Pacific other than Bangladesh. Pakistan and Cambodia emerge as strong contenders with excellent RCAs (Pakistan: 12.7, Cambodia: 19.2) and positive CAGRs (Pakistan: 10.8 per cent, Cambodia: 4.65 per cent). Sri Lanka, despite its low market share, maintains a decent CAGR and RCA.
Among the top 13 countries in the Asia-Pacific region, all others have market shares below 2 per cent, collectively accounting for approximately 59 per cent of the market. Thailand, the Republic of Korea, Japan, and Australia each have shared below 1.0 per cent, with insignificant CAGRs and RCAs, excluding them from competitive consideration.
In summary, China's dominance as the clear market leader in apparel exports (HS 61-62) is par excellence, despite occasional dips in market share over the years. Bangladesh and Vietnam follow closely, consistently increasing their overall market share. India's share has experienced slight depletion over the years. Pakistan and Cambodia are the strong contenders in the years to come.
Home Textiles
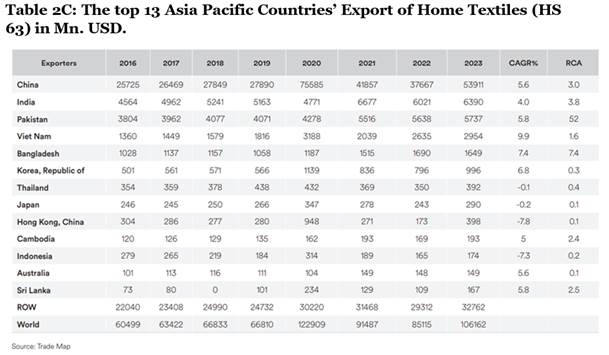
In the Home textiles market segment, as depicted in Table 5C covering exports in millions of USD from 2016 to 2023 for the top 13 countries, several significant insights emerge.
China leads with a commanding global export market share of 50.78 per cent in 2023 coupled with a notable Compound Annual Growth Rate (CAGR) of 5.65 per cent, indicating sustained growth over the past eight years. Moreover, China boasts a highly Revealed Comparative Advantage (RCA), suggesting that the country stands to benefit significantly from the production and export of home textiles. China has maintained a dominant position as the clear leader in global exports of home textiles throughout the years. Notably, in 2020, there was a substantial surge in China's export share to 81.5 per cent, attributed to the COVID-19 pandemic and increased demand for home textiles during lockdowns.
India emerges as the second-largest exporter in this category, with a 4 per cent CAGR and an RCA of 3.8, further solidifying its position as a major player in the global home textiles market. India reached its highest share in 2018 at 12.5 per cent but experienced a decline to around 5.1 per cent in 2020. Similarly, Pakistan, Vietnam, and Bangladesh followed a similar trajectory, losing part of their export market share to China in 2020 due to the pandemic, yet managing to recover to a large extent by 2022.
Pakistan and Vietnam also showcase strong competitiveness, with Pakistan cornering a market share of 5.4 per cent, and a high CAGR of 5.8 per cent demonstrating an exceptionally high RCA of 52. Vietnam having a market share of 2.78 per cent, on the other hand, boasts of the highest CAGR globally at 9.9 per cent, certainly a commendable achievement.
It's worth highlighting that despite Cambodia and Sri Lanka having minimal export shares during the period of analysis, both countries display commendable RCAs and CAGRs, indicating potential for growth and competitiveness in the future.
While several other countries hold less than 1.0 per cent market shares, notable among them are Thailand, Japan, Hong Kong, and Indonesia, which exhibit negative CAGRs, signalling challenges in their home textiles export sectors.
In summary, China, India, Pakistan, Vietnam, and Bangladesh emerged as the top contenders with comparative advantages in the global home textiles market within the Asia-Pacific region. The Republic of Korea has a comparative advantage and is growing at a faster rate but remains uncompetitive in its exports. Cambodia displaying exceptional growth and comparative advantage of Cambodia revealed.
Export Basket Intensity: A Comparative Study of Product Groups Across Countries
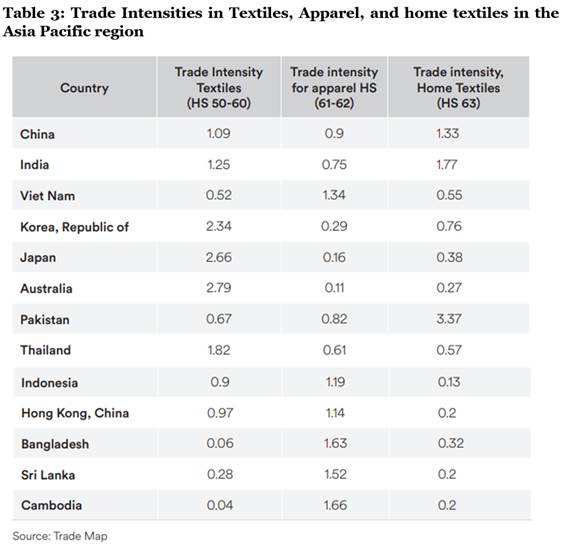
Table 3 records the Trade Intensity of the top 13 countries for three categories: Textiles (HS 50-60), Apparel (HS 61-62), and Home Textiles (HS 63). Trade intensity is typically measured as the ratio of a country's exports plus imports of a particular category to its world trade in that category.
For Textiles (HS 50-60)
Korea, the Republic of has the highest trade intensity at 2.34, followed by Japan at 2.66 and Australia at 2.79.
Bangladesh has the lowest trade intensity at 0.06, followed by Cambodia at 0.04. Bangladesh is a major producer and supplier of apparel and mostly depends on the import of raw materials that is fabrics and other home textiles for value addition and export.
For Apparel (HS 61-62)
Bangladesh at 1.63 and Vietnam (1.34) are major suppliers of apparel other than Sri Lanka has the highest trade intensity at 1.66, followed by Cambodia at 1.63 and Indonesia (1.19) and Hongkong (1.14). China being a major supplier of all three group products does not show a high intensity of apparel exports and neither does India.
Japan has the lowest trade intensity at 0.16, followed by Australia at 0.11.
For Home Textiles (HS 63)
As seen earlier, China, India and Pakistan are the major suppliers of home textiles to the world. Pakistan has the highest trade intensity at 3.37, followed by India at 1.77 and China at 1.33.
Indonesia has the lowest trade intensity at 0.13, followed by Hong Kong.
These numbers indicate the relative importance of each category of goods to the economies of the respective countries' exports of that category, with higher values suggesting a larger share of trade in that category.
Ending Note
The Asia-Pacific region holds a dominant position in the global textile and apparel market, with China leading in textiles, Bangladesh in apparel, and China again in home textiles. Despite recent challenges like the COVID-19 pandemic and regional conflicts, countries like Cambodia and Vietnam show promising growth. India, Pakistan, and Vietnam also demonstrate strong competitiveness. However, challenges remain for some countries like Hong Kong and Japan, highlighting the need for strategic adaptation in the ever-evolving global trade landscape.


Comments